A trading card vending machine can make money in 2026, but the cabinet does not create the profit by itself. The real business is the combination of merchandise margin, stock turnover, qualified customer traffic, payment cost, location terms and dispensing reliability. A machine doing $5,400 in monthly sales can produce a healthy contribution under one cost structure and almost nothing under another. That is why I would judge trading card vending machines on contribution per machine per month rather than on gross revenue or headline equipment price.
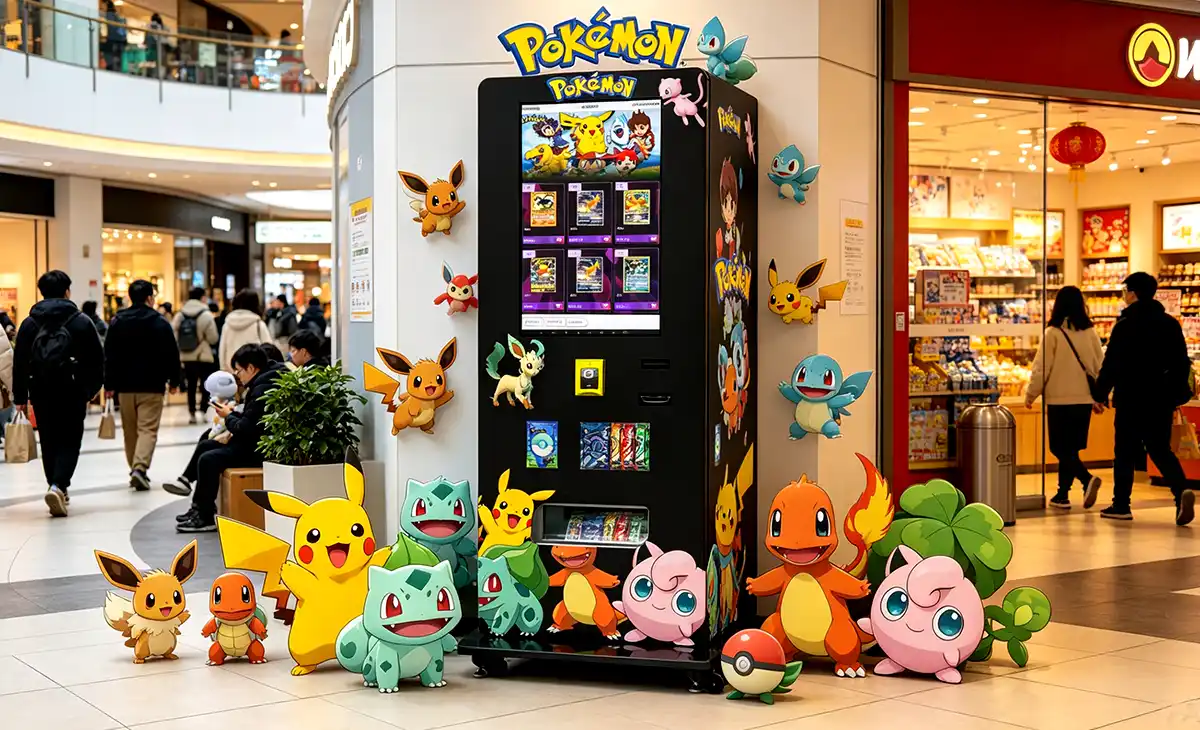
Short answer: Yes. A well-placed trading card vending machine with a 30%–40% merchandise gross margin, manageable venue cost and steady inventory turnover can produce an attractive return. The same machine in the wrong location or filled with thin-margin products may struggle even when sales look respectable.
The figures in this guide are planning models rather than promises of earnings. They are designed to show how the economics change when sales volume, product cost and location commission move.
Are Trading Card Vending Machines Actually Profitable?
A profitable machine is usually less dramatic than the videos that make automated retail look effortless. Customers buy products. The machine processes payment and releases the item. Stock runs down. Someone replenishes it. The result is only attractive when enough margin remains after all of those steps.
That sounds obvious, yet gross sales are still the number that gets too much attention. A machine showing $6,000 of monthly revenue may look impressive until $4,000 goes back into merchandise, $720 goes to the venue, payment charges take another $200 and servicing consumes the next $200.
The practical question is not, “How much can trading card vending machines sell?” It is, “How much cash does each machine keep after the costs required to make those sales?”
For this comparison, I’m prioritizing five numbers:
- Merchandise gross margin — the selling price left after product cost.
- Sales velocity — how quickly inventory converts back into cash.
- Venue cost — fixed rent or revenue share paid for the placement.
- Transaction cost — payment charges attached to each purchase.
- Operating contribution — what remains after the recurring costs that support the machine.
Equipment price matters, but it is a one-time variable. A weak margin or expensive venue agreement hurts the business every month.
Consider a simple example. Saving $400 on a machine feels useful. If the cheaper machine causes only $40 more in monthly refunds, additional service visits or lost sales, that saving disappears within ten months. A six-percentage-point difference in venue commission on $5,400 monthly sales is worth $324 every month, or $3,888 over a year.
That is why the equipment quote should not be the first number used to judge a project.
Those numbers are not an earnings forecast. They are a benchmark for thinking clearly about the relationship between sales and profit.
The base model assumes 450 units sold per month at an average selling price of $12. Merchandise costs 65% of revenue, the venue receives 12%, payment expenses are modeled conservatively, and another allowance covers shrinkage and ordinary operating costs. Change any of those assumptions and the result changes immediately.
That sensitivity is not a weakness of the business model. It is the reason disciplined operators can outperform casual ones.
Why Trading Card Vending Still Makes Sense in 2026
There are two separate reasons to take the category seriously: continuing collectible demand and the physical characteristics of card products.
Circana reported that value sales across its tracked toy markets increased 14% during the first half of 2026 compared with the same period a year earlier. Its analysis identified fandom, licensing and collectibles as common drivers of that momentum.
The preceding year provides another useful benchmark. Circana reported 32% growth in collectibles, with collectible products approaching 19% of tracked toy dollar sales. Trading cards were also among the faster-growing segments associated with older consumers and hobby purchasing.
Neither statistic proves that every trading card vending machine will perform. They do show that an automated card retailer is being built around an active hobby rather than a product category searching for customers.
PSA provides a different view of the same underlying activity. Its public backlog tracker reported approximately 10.9 million active items on August 25, 2026 after substantial processing capacity expansion. Earlier in the year, PSA attributed a sharp backlog increase to a 20% submission spike.
Grading volume should not be confused with retail vending demand, but it demonstrates the amount of activity surrounding card ownership, collection, authentication and resale.
The second part of the case is more mechanical.
Trading card packs and small collectible products have unusually high retail value relative to the physical space they occupy. A traditional vending cabinet may need a large volume of beverages to generate meaningful sales. A collectible card vending machine can hold substantial retail value without refrigeration or heavy product handling.
That gives operators several useful advantages:
- high retail value per cabinet footprint;
- multiple price tiers inside one machine;
- no refrigeration for standard sealed card products;
- easy digital merchandising on a touchscreen;
- repeat purchasing from collectors;
- compact refill inventory;
- opportunities to combine cards with accessories.
NAMA’s latest convenience-services census also highlights the continuing development of self-service retail and unattended purchasing formats. The card business is not identical to food and beverage vending, but customers are increasingly familiar with paying at an unattended interface and completing the transaction without a cashier.
That customer familiarity matters. A vending concept has a lower behavioral hurdle when the buyer already understands touchscreen selection, contactless payment and self-service pickup.
Cards have another advantage: buyers often arrive knowing the product
A vending machine struggles when the merchandise requires a long explanation from a salesperson.
Recognizable sealed products are different. The customer may already know the set, package type, release and approximate value before approaching the machine. The screen needs to present the product accurately, but it does not have to recreate a lengthy sales consultation.
That is one reason trading card vending machines can work as compact extensions of specialty retail.
A machine can handle routine purchases while staff focus on transactions that require inspection, advice, grading discussions or higher-touch customer service.
Demand still has to be matched to the site
Category growth should never be used as a substitute for location research.
A popular hobby does not make every building a good placement. The machine still needs people who recognize the products, have a reason to stop and are comfortable buying at the price presented.
That is where automated retail becomes a site-selection business rather than a machine-buying business.
How a Trading Card Vending Machine Actually Makes Money
The operating equation is simple:
Revenue − merchandise cost − venue cost − payment cost − shrinkage − servicing − recurring operating cost = operating contribution.
Every serious projection should start there.
Merchandise margin is the first filter
Assume one sealed product sells for $12 and costs $7.80.
The merchandise gross profit is $4.20, or 35% of the selling price.
That $4.20 still has to support payment fees, location cost, product loss, service and profit.
Now imagine the venue receives 12% of gross sales. That removes $1.44 from the transaction. If payment cost averages another $0.45 and variable operating loss averages $0.20, approximately $2.11 remains.
The product still works if it sells often enough. It becomes less attractive if it occupies a lane for months.
Turnover can beat unit margin
A common merchandising error is filling a machine with the products that offer the highest profit per unit.
The better measurement is often contribution per lane per month.
| Product | Selling Price | Contribution Per Unit | Units Per Month | Contribution From Lane |
|---|---|---|---|---|
| Product A | $9 | $2.10 | 65 | $136.50 |
| Product B | $28 | $7.50 | 11 | $82.50 |
| Product C | $15 | $4.10 | 42 | $172.20 |
Product B looks attractive when the operator sees $7.50 of contribution on a sale. Product C creates more value from the same merchandising position because it moves faster.
This is where remote sales reporting becomes genuinely useful. It lets the operator stop guessing which products “feel popular” and compare what each lane actually earns.
The venue agreement can make or break the model
Placement terms tend to appear in several forms:
- fixed monthly rent;
- percentage of gross sales;
- minimum payment plus revenue share;
- revenue share after a sales threshold;
- placement as part of another commercial arrangement.
A fixed fee can be excellent in a strong location because the site does not become more expensive as sales rise. It is less forgiving during slow months.
A revenue share gives the operator some protection when sales fall, but the venue participates in every increase.
Neither structure is automatically superior. The right choice depends on expected sales and how much risk each side is taking.
Payment fees matter more on low-value purchases
A percentage charge is easy to understand. A fixed transaction charge has a larger effect when the average purchase is small.
If the customer buys one $6 pack, a fixed $0.10 component represents 1.67% of revenue before any percentage fee is added.
If the same customer buys $24 of products in one transaction, that $0.10 represents only 0.42%.
This is one reason basket-building can improve trading card vending machine economics without raising individual product prices.
The operator can encourage a larger purchase through:
- related products shown together;
- multi-item offers;
- accessories next to card products;
- clear presentation of premium options;
- simple add-on prompts.
The interface should stay easy to understand. Too many promotional screens create friction in what should be a quick transaction.
Trading Card Vending Machine Profit: Three Realistic Planning Scenarios
The following model is intentionally conservative enough to expose weak locations. It is not based on a claimed customer route or private financial record.
| Metric | Weak Site | Workable Site | Strong Site |
|---|---|---|---|
| Items sold per day | 6 | 15 | 28 |
| Items sold per month | 180 | 450 | 840 |
| Average selling price | $10 | $12 | $15 |
| Monthly revenue | $1,800 | $5,400 | $12,600 |
| Merchandise gross margin | 28% | 35% | 40% |
| Merchandise gross profit | $504 | $1,890 | $5,040 |
| Venue cost | 15% / $270 | 12% / $648 | 10% / $1,260 |
| Modeled payment expense | $76 | $207 | $468 |
| Shrink/damage allowance | $18 | $54 | $126 |
| Other operating cost | $140 | $150 | $260 |
| Monthly operating contribution | $0 | $831 | $2,926 |
The weak site is the most useful column.
It is not failing because customers refuse to use the machine. It still produces $1,800 of monthly revenue. The problem is that the combination of thin merchandise margin, venue commission and operating expense absorbs nearly all of the value.
That is the kind of machine an operator can mistakenly leave in place because the sales dashboard looks active.
The workable site is a much healthier business. At $5,400 monthly revenue and approximately $831 of operating contribution, it can justify a modest equipment investment without requiring unrealistic transaction volume.
The strong site demonstrates operating leverage. Revenue is only 2.33 times the workable scenario, while operating contribution is roughly 3.5 times higher because merchandise margin improves and the venue percentage is lower.
Margin sensitivity at the same sales volume
Keeping monthly revenue at $5,400 shows how much sourcing changes the answer.
| Merchandise Gross Margin | Gross Merchandise Profit | Change vs. 35% Base | Commercial Reading |
|---|---|---|---|
| 25% | $1,350 | −$540/month | Very sensitive to rent and payment cost |
| 30% | $1,620 | −$270/month | Can work with good volume and disciplined site cost |
| 35% | $1,890 | Base | More room for ordinary automated-retail costs |
| 40% | $2,160 | +$270/month | Stronger ability to absorb venue and service costs |
| 45% | $2,430 | +$540/month | Excellent on paper if demand remains strong |
A ten-percentage-point change in merchandise margin is worth $540 per month on the same $5,400 of sales.
Over twelve months, that is $6,480.
This is why saving a few hundred dollars on the original machine is rarely the biggest lever in the business.
Venue commission sensitivity
| Venue Share on $5,400 Sales | Monthly Venue Cost | Difference vs. 12% |
|---|---|---|
| 8% | $432 | +$216 retained |
| 10% | $540 | +$108 retained |
| 12% | $648 | Base |
| 15% | $810 | −$162 retained |
| 18% | $972 | −$324 retained |
An 18% site instead of a 12% site costs another $3,888 over twelve months at the same sales level.
That single contract term can be worth more than the price difference between many machine configurations.
“For trading card vending, gross sales tell only half of the story. The number worth protecting is contribution after merchandise, venue and payment costs.”
— Zhongda Smart Editorial & Vending Engineering Team
Get a Machine Configuration Based on the Products You Actually Plan to Sell
Send your pack dimensions, product types, target capacity and payment requirements. Zhongda Smart can review the dispensing layout before the cabinet configuration is finalized.
Get My Custom Configuration Selected configurations support pilot orders from one unit. Final capacity and specifications depend on product testing and project requirements.How Many Sales Does a Trading Card Vending Machine Need to Break Even?
Break-even is easier to understand when the operator separates fixed and variable costs.
Suppose the machine has:
- $250 of fixed monthly site and operating costs;
- 35% merchandise gross margin;
- approximately 4% variable payment and loss cost;
- no additional revenue share because the site uses fixed rent.
The approximate contribution margin available to cover fixed expense is:
35% − 4% = 31%.
Monthly break-even sales are therefore:
$250 ÷ 31% = approximately $806.
That is the operating break-even point before recovering the original equipment investment.
If the same site has a 12% revenue share instead of fixed rent, the contribution available after merchandise, payment and venue cost becomes approximately:
35% − 4% − 12% = 19%.
If another $150 of monthly fixed operating expense remains, sales required to cover that fixed cost are:
$150 ÷ 19% = approximately $789.
The more useful calculation is usually the sales required to reach a target monthly contribution.
Sales needed for a $1,000 monthly contribution
With a 19% contribution margin before fixed operating expense and $150 in monthly fixed cost:
Required revenue = ($1,000 + $150) ÷ 19% = approximately $6,053 per month.
At a $12 average item price:
$6,053 ÷ $12 = approximately 504 items per month.
That equals about:
16.8 items per day.
The number is useful because it turns an abstract profit goal into an operating requirement.
Instead of saying, “I want this machine to make $1,000 per month,” the operator can ask whether the site realistically supports about 17 item sales per day at the assumed price and cost structure.
Equipment payback is a second break-even point
Operating break-even only tells you whether the machine covers its monthly costs.
Capital payback asks how quickly the initial investment comes back.
If equipment and related setup total $5,000:
| Monthly Contribution | Simple Equipment Payback |
|---|---|
| $250 | 20.0 months |
| $500 | 10.0 months |
| $750 | 6.7 months |
| $1,000 | 5.0 months |
| $1,500 | 3.3 months |
This table is deliberately simple. It does not include financing, taxes, depreciation, inventory investment or changes in monthly performance.
A more conservative approach calculates payback on the total cash committed.
If the project requires $5,000 of equipment and setup plus $3,500 of opening inventory, the capital committed at launch is $8,500.
At $831 of monthly contribution, simple payback on the complete initial cash position is roughly 10.2 months rather than six months.
That is the number I would use for internal planning because inventory is real money even though it remains an asset.
What It Really Costs to Start a Trading Card Vending Business
A machine price is not a startup budget.
The full project usually includes equipment, payment hardware, freight, initial inventory, branding, spare parts, site setup and working capital.
| Cost Category | Illustrative Planning Range | What Changes the Number |
|---|---|---|
| Vending equipment | $1,500–$5,000+ | Cabinet size, screen, delivery system and customization |
| Payment hardware/setup | $200–$800+ | Terminal, provider and integration |
| Branding/custom work | $0–$1,500+ | Wrap, interface, lighting and structural work |
| Freight and handling | $500–$2,500+ | Machine size, shipment method and final delivery |
| Opening inventory | $1,500–$8,000+ | Product value, assortment and machine capacity |
| Spare parts/tools | $100–$500+ | Machine type and service plan |
| Site setup | $0–$1,000+ | Power, positioning, signage and agreement terms |
| Working-capital reserve | $1,000–$5,000+ | Restocking cycle and product cost |
These are planning ranges, not Zhongda Smart quotations. A final machine price should be based on the actual configuration.
Inventory is often the underestimated cost
Trading cards are compact, which is an advantage for merchandising but can hide how much money is sitting inside the cabinet.
Imagine 300 products averaging $10 of cost.
That is $3,000 of inventory inside one machine.
If the operator keeps another $2,000 of fast-moving replacement stock, the merchandise commitment is already equal to or greater than many hardware budgets.
A route with five machines magnifies the problem. Inventory might be distributed across machines, reserve stock, inbound orders and slow-moving products. Without disciplined stock records, cash becomes difficult to trace.
Do not spend working capital on cosmetic upgrades
Large touchscreens, lighting and premium cabinet graphics can improve presentation. They are useful when they support the brand and the site.
They should not consume the cash needed to keep high-velocity products in stock.
A beautiful machine with empty bestseller lanes is a weak retail asset.
For a first deployment, I’d choose the configuration that protects the product and supports the operating model before paying for nonessential visual upgrades.
Published machine prices need context
Zhongda Smart currently publishes several card-selling platforms with different cabinet sizes, screen options, product capacities and delivery methods. The custom trading card vending machine platform can be configured with 21.5-inch or 32-inch touchscreen options, 4G/Wi-Fi/LAN connectivity depending on the build, multiple payment methods and either drop or elevator-style delivery.
A listed base price should be treated as a starting equipment reference, not a turnkey business budget. Payment hardware, custom delivery engineering, branding, freight and project-specific work can change the final quotation.
What Products Work Best in Trading Card Vending Machines?
The best vending product is not always the highest-value card product.
A strong SKU combines demand, predictable dimensions, enough margin, acceptable inventory cost and reliable delivery.
Sealed booster packs
Sealed packs are an obvious fit because buyers understand them and the packaging is compact.
The engineering issue is consistency.
Loose foil packaging can flex, slide or catch differently from a rigid retail box. Two products that appear similar in a photograph may behave differently in the same spiral or channel.
The operator should record:
- package width;
- package height;
- package thickness;
- product weight;
- flexibility;
- surface friction;
- acceptable drop distance.
Actual samples are better than approximate measurements when the machine layout is being finalized.
Sleeved packs
A retail sleeve adds rigidity and can make dispensing more predictable.
The tradeoff is capacity. A sleeved product usually occupies more depth or width than the loose pack inside it.
That means operators should compare reliable sales capacity, not theoretical maximum capacity.
A machine that holds 500 products but mis-vends frequently is inferior to a machine holding 380 products that dispenses correctly.
Small sealed boxes
Boxes can lift the average transaction value and create a premium tier inside the machine.
They also make package condition more important.
Before using ordinary drop delivery, check:
- drop height;
- box corner protection;
- product weight;
- internal movement;
- how the product lands in the pickup area.
Collectors may reject packaging damage that would be irrelevant in many other vending categories.
Graded slabs
A high-value graded card should not automatically be sent through the same mechanism used for an inexpensive sealed pack.
The plastic holder is rigid, but the value of the item changes the acceptable level of mechanical risk.
A locker, controlled compartment or elevator-delivery system is usually easier to justify when individual items have meaningful replacement value.
The customer interface also needs to be more precise if each slab is unique. The screen should make clear exactly what is being purchased rather than showing a generic category image.
Accessories
Accessories can improve the economics of a collectible card vending machine.
Depending on the assortment, compatible products may include:
- card sleeves;
- top loaders;
- deck boxes;
- storage products;
- protective holders;
- other authorized hobby accessories.
They can create add-on sales without competing for exactly the same margin structure as sealed cards.
Use a price ladder
A machine filled only with premium products asks every customer to make a high-value decision.
A machine filled only with inexpensive products requires high transaction volume.
A balanced assortment often works better:
- entry-price products for easy purchases;
- core products that generate the majority of volume;
- a controlled number of premium products;
- related accessories.
The mix should evolve from actual sales rather than remain fixed because it looked balanced on launch day.
Location Changes the Economics More Than Most Machine Features
“High traffic” is not a complete location strategy.
What matters is the number of people likely to recognize the product, stop, pay and return.
One thousand relevant visitors can outperform many thousands of unrelated passersby.
What a productive site tends to have
- repeat visitors;
- a meaningful overlap with hobby or collectible buyers;
- enough dwell time to browse the touchscreen;
- good machine visibility;
- safe product and payment access;
- reliable network connectivity;
- reasonable placement cost;
- easy access for restocking and service.
Measure conversion instead of foot traffic
Suppose 1,500 people pass the machine each day.
At a 0.4% transaction rate:
1,500 × 0.4% = 6 transactions per day.
At a 1.0% transaction rate:
1,500 × 1.0% = 15 transactions per day.
At the same foot traffic, conversion changes sales volume by 150%.
That is why the quality of traffic matters more than the headline count.
Average basket changes the picture again
If 15 customers buy each day but spend only $8 on average, monthly revenue is approximately:
15 × $8 × 30 = $3,600.
At a $14 average basket:
15 × $14 × 30 = $6,300.
The machine serves the same number of customers. Product mix and basket value create a $2,700 monthly difference.
A trial placement is valuable when available
A short test period gives the operator evidence that a spreadsheet cannot provide.
Useful first-month data includes:
- transactions per day;
- revenue per day;
- average basket;
- sales by product;
- stockouts;
- refunds;
- payment failures;
- time required to restock;
- customer support incidents.
A weak site should not be defended indefinitely because the machine was expensive to install.
Relocation is one of the most powerful advantages vending has over a fixed retail store.
Choosing the Right Trading Card Vending Machine
There is no universal best machine because cards are not one standardized product.
A booster-pack business, a sports card vending machine, a graded-card kiosk and a mixed collectible business can need different delivery systems.
| Machine Format | Best Use | Main Strength | Main Tradeoff |
|---|---|---|---|
| Full-size touchscreen machine | Broad product mix and higher volume | Capacity, visibility and merchandising space | Larger footprint and freight cost |
| Compact floor machine | Focused assortment and site testing | Efficient footprint | More frequent restocking |
| Wall-mounted unit | Small standardized products | Uses wall space instead of floor space | Lower capacity and narrower product range |
| Elevator-delivery machine | Products sensitive to impact | Gentler delivery | More moving components |
| Locker machine | Premium or irregular products | Strong product protection | Lower storage density |
| Custom hybrid | Mixed packs, boxes, slabs and accessories | Built around the assortment | More engineering before production |
Do not buy capacity you cannot use
A large lane count looks impressive in a specification table.
It becomes expensive when the operator has to fill every lane with slow inventory just to make the machine look complete.
Capacity should follow three numbers:
- number of SKUs;
- sales velocity per SKU;
- planned days between refills.
If one top product sells five units per day and the desired refill interval is seven days, the operator needs at least 35 units of practical capacity for that SKU, plus a safety allowance.
A product selling twice per month does not deserve the same stock depth.
Screen size is a merchandising choice
A larger screen is helpful when product images, categories and promotions are important.
It does not improve profit if the site does not convert customers.
For a straightforward assortment of 15 products, an enormous screen may add little operational value. For a machine displaying dozens of products and richer product information, a larger touchscreen can make browsing easier.
Delivery should match product value
For this comparison, I would rank reliable delivery ahead of maximum capacity.
The logic is simple: every damaged or failed transaction creates more than the cost of the item.
It can also create:
- a refund;
- a payment dispute;
- a support message;
- a service trip;
- lost customer confidence;
- negative word of mouth.
The right dispensing system prevents problems that do not appear on the original purchase invoice.
Zhongda Smart Engineering Notes for Trading Card Vending Machines
The most useful manufacturing decision happens before the cabinet is built: confirm what the machine is expected to dispense.
Zhongda Smart’s custom card platform is designed around product dimensions, capacity, payment configuration and preferred delivery method rather than treating every collectible product as a standard snack-machine SKU.
The published custom platform supports multiple touchscreen sizes, 4G/Wi-Fi/LAN connectivity depending on configuration, remote management, cashless payment options and both elevator and drop-delivery structures. Selected configurations start from one unit, which allows a pilot build before a broader rollout.
Product-to-delivery planning matrix
| Product Type | Main Engineering Concern | Preferred Planning Approach |
|---|---|---|
| Loose booster pack | Flexing, friction and inconsistent movement | Test the actual pack and tune lane dimensions |
| Sleeved pack | Larger footprint but greater rigidity | Balance capacity against predictable dispensing |
| Small collector box | Corner damage and drop impact | Check weight, drop height and pickup-bin landing |
| Graded slab | High product value and rigid holder | Consider locker or controlled elevator delivery |
| Accessories | Mixed dimensions | Use adjustable channels or separate product zones |
| Mixed assortment | No single channel suits every SKU | Configure the internal layout around representative samples |
“The cabinet should follow the merchandise. Pack dimensions, rigidity, product value and acceptable drop distance should be confirmed before the internal dispensing layout is locked.”
— Zhongda Smart Editorial & Vending Engineering Team
Why sample testing matters
A dimension such as 70 × 120 mm does not describe everything about a package.
Two packs of the same external size can behave differently because of:
- surface material;
- internal product movement;
- weight distribution;
- package stiffness;
- edge shape;
- seal thickness.
That is why product samples are useful during engineering review.
A machine manufacturer can adjust channel spacing, spiral dimensions, shelves or delivery method before production instead of solving repeated mis-vends after installation.
Manufacturing depth becomes more important with customization
Zhongda Smart reports a manufacturing facility of approximately 20,000 square meters, more than 400 employees, an engineering team of 10+ and annual capacity of about 10,000 machines. Its manufacturing program covers cabinet fabrication, assembly, electrical integration, software, OEM/ODM customization and quality-control processes.
More detail on those capabilities is available in the company’s Zhongda Smart company and manufacturing profile and its guide to how Zhongda Smart manufactures and customizes vending machines.
Those factory figures are relevant to a buyer for one reason: customization is useful only when the manufacturer can repeatedly build the approved configuration.
A successful prototype is not enough for a network rollout. The production version needs consistent cabinet dimensions, wiring, channels, payment preparation and software configuration.
Standardize what should be standardized
Customization does not mean redesigning every part of a vending machine.
A stronger project keeps proven components where they already solve the problem and modifies the areas that matter:
- product delivery;
- internal channel layout;
- payment integration;
- cabinet graphics;
- touchscreen interface;
- connectivity;
- selected software functions.
That approach reduces unnecessary engineering while still building the machine around the business.
Inventory, Payments and Maintenance Decide the Long-Term Result
A machine can have strong first-month sales and still become a poor investment if day-to-day operation is weak.
The three areas that deserve continuous attention are stock turnover, payment performance and uptime.
Inventory turnover: measure days of supply
Suppose one SKU sells four units per day and the machine contains 32 units.
Days of supply:
32 ÷ 4 = 8 days.
If the machine is serviced every seven days, that stock depth is reasonable.
Another product sells one unit every five days and has 25 units in the machine.
That represents approximately 125 days of supply.
The second lane has far more cash trapped in inventory than its velocity justifies.
Use an A/B/C inventory system
A simple classification works well:
- A products: high-velocity products that drive repeat sales;
- B products: dependable mid-volume products;
- C products: experimental, premium or slower inventory.
A products deserve deeper stock.
B products deserve enough inventory to cover the refill cycle.
C products should be kept shallow until demand proves otherwise.
Track stockouts as lost opportunity
A sold-out bestseller is not the same as a slow lane.
If an A product is consistently unavailable for two days before every refill, the operator has evidence that stock depth or service frequency is wrong.
That is where remote inventory visibility saves more than travel.
It helps the operator identify which locations need urgent attention and which can wait.
Payment performance should be tracked separately
A payment terminal can appear to work while conversion quietly suffers.
Useful payment metrics include:
- approved transactions;
- declined transactions;
- abandoned purchases;
- average basket value;
- refund volume;
- payment-system downtime.
If many customers begin checkout but do not complete payment, investigate the experience before blaming product demand.
Contactless payment matters for speed
Trading card purchases are often straightforward. A customer who already knows the product should not need a long payment flow.
The exact terminal and merchant service should be selected according to the operator’s requirements.
Before ordering equipment, confirm:
- who supplies the terminal;
- which payment methods it accepts;
- how it connects to the machine;
- who provides transaction support;
- how refunds are processed;
- what fixed and variable fees apply.
“Supports card payment” is not detailed enough for a commercial purchase.
Vending machine repair should be planned before a failure
Every commercial machine eventually needs service.
The important question is how quickly common problems can be identified and corrected.
A useful spare-parts plan may include selected:
- motors;
- sensors;
- switches;
- fuses;
- cables;
- locks;
- controller-related components;
- payment accessories.
The correct kit depends on the machine.
Zhongda Smart’s published card-machine program includes a one-year warranty on selected models together with replacement-parts and online technical support. Buyers should confirm the exact warranty and included support for the final quotation.
Downtime has a measurable cost
Assume a machine normally generates $180 in daily revenue with a 20% operating contribution.
Four days offline represents:
$180 × 4 = $720 of missed revenue opportunity.
At the modeled contribution rate:
$720 × 20% = $144 of missed operating contribution.
The real cost may be higher if customers stop checking the machine after finding it unavailable.
Create the refund process before launch
An automated machine should clearly tell the customer what to do when something goes wrong.
Common support cases include:
- payment approved but product not delivered;
- incorrect product;
- damaged packaging;
- duplicate charge;
- pending transaction;
- customer misunderstanding.
A phone number, QR support page or other visible contact method is better than leaving the customer to search for the operator.
Fast resolution protects repeat business.
Track mis-vends by SKU, not just by machine
If one product fails repeatedly while 25 others dispense correctly, the issue may be the package rather than the complete machine.
A simple service log should record:
- machine ID;
- lane;
- SKU;
- time and date;
- failure description;
- customer outcome;
- corrective action.
Patterns appear quickly once incidents are recorded consistently.
Pricing Trading Cards Without Damaging Customer Trust
Automated retail offers convenience, extended availability and immediate purchase. Those benefits can support a reasonable convenience premium.
They do not justify pricing that makes the machine feel exploitative.
Collectors frequently know the approximate market value of common sealed products.
If a widely available item is consistently priced far above what customers consider reasonable, the machine may produce a few high-margin transactions while losing repeat usage.
Start from landed product cost
The invoice price is not always the true merchandise cost.
Include the expenses required to put inventory into sellable condition.
Then add the variable costs attached to vending:
- venue share;
- payment charges;
- expected shrinkage;
- restocking;
- support;
- maintenance allowance.
Use contribution targets instead of arbitrary markup
Assume a product costs $8.
At a $10 retail price, merchandise gross margin is 20%.
At $12, margin becomes 33.3%.
At $14, margin becomes 42.9%.
The $14 price looks financially attractive, but only if customers still buy the product.
Price elasticity therefore matters as much as markup.
Do not confuse scarcity with permanent pricing power
Card-product availability can change quickly.
A product that supports a premium during a short supply period may become ordinary inventory later.
Remote price management is useful because it lets operators respond without replacing physical labels, but it should not become an excuse for constant speculative repricing.
Stable, understandable pricing helps build trust in the machine.
Bundles can improve average basket value
When the delivery method supports it, a bundle can increase basket value without relying on extreme pricing of one item.
The bundle should be transparent. Customers need to know exactly what they are buying.
Avoid descriptions that imply guaranteed collectible value, investment returns or specific rare contents unless those statements are demonstrably true and legally appropriate.
A 90-Day Launch Plan for a New Machine
The first 90 days should be treated as an operating test rather than a victory lap.
Days 1–30: Establish clean baseline data
Avoid changing the price and product mix every few days.
Record:
- daily revenue;
- daily transactions;
- items sold;
- average basket;
- sales by SKU;
- stockouts;
- payment failures;
- refunds;
- mis-vends;
- restock time.
The first month tells you whether the original assumptions were realistic.
Days 31–60: Reallocate inventory
By the second month, the machine usually starts revealing clear product winners and losers.
Increase stock depth on fast products.
Reduce the quantity of slow products.
Do not remove every slow SKU automatically. Some premium products may sell infrequently but still add useful contribution and improve the appearance of the assortment.
The question is whether the inventory investment is justified.
Days 61–90: Judge the site
At this point, calculate:
- monthly revenue;
- merchandise gross profit;
- venue expense;
- payment expense;
- service cost;
- operating contribution;
- inventory turnover;
- estimated capital payback.
Then make one of four decisions:
- keep the machine and continue optimizing;
- increase capacity because demand exceeds the current setup;
- relocate because the site is structurally weak;
- exit the concept because the economics do not justify more capital.
A machine should not remain in a weak placement simply because moving it feels inconvenient.
How to Scale from One Machine to a Small Network
The first machine proves the concept.
The next machines test whether the operating process can be repeated.
Scaling adds problems that do not exist at one unit:
- inventory is split across multiple cabinets;
- service routes consume more time;
- different sites prefer different products;
- payment reconciliation becomes larger;
- spare-parts management matters more;
- software becomes part of daily operations.
Standardize the hardware where it makes sense
If ten machines all use different payment devices, motors, locks and software, servicing becomes unnecessarily difficult.
A growing route benefits from common core hardware.
Branding, product selection and lane configuration can still vary where the site requires it.
Do not standardize inventory blindly
One location may respond to lower-price products.
Another may support premium boxes.
A third may generate more accessory sales.
The machine platform can be consistent without forcing identical merchandise into every site.
Route density affects profitability
Three machines close enough to service in one trip may be more attractive than three higher-revenue machines that each require a separate long journey.
Travel does not appear on the touchscreen, but it belongs in the P&L.
Track:
Operating contribution generated between visits ÷ service hours required.
That metric exposes locations that look profitable until labor and travel are included.
Central inventory needs its own controls
Once the route grows, inventory exists in several states:
- inside active machines;
- reserve stock;
- incoming stock;
- allocated stock;
- slow inventory awaiting transfer;
- damaged stock;
- returned stock.
A business can show strong sales while cash disappears into uncontrolled inventory.
The inventory system should be ready before adding machines quickly.
Pilot before a large rollout
If I were choosing for a new automated card concept, I would rather validate one properly configured machine than learn about a dispensing problem after a large order has been produced.
A one-unit pilot can validate:
- product fit;
- payment flow;
- software;
- customer behavior;
- service procedure;
- actual inventory capacity;
- refund rate;
- location economics.
Zhongda Smart’s selected OEM configurations support a starting MOQ of one unit, which makes that pilot approach practical for projects that do not yet have operating history.
The company also maintains a broader trading card vending machine business and configuration guide for buyers comparing product formats, operating budgets and machine structures.
Why Trading Card Vending Machines Underperform
1. The location has traffic but not buyers
Crowds are not enough.
A machine needs people who have both interest and willingness to purchase the products being offered.
2. Merchandise margin is too thin
A popular product can create plenty of sales and still contribute almost nothing after venue and payment costs.
Revenue should never be used as a substitute for gross-margin analysis.
3. The venue receives too much of every sale
High commission can turn a good sales location into a poor investment.
Model the venue share in dollars over twelve months before agreeing to the percentage.
4. Product dimensions were never tested
This is one of the most preventable problems.
A generic channel selected from a photograph may not dispense a flexible card pack reliably.
Provide measurements and, where possible, actual product samples before final production.
5. Too much speculative inventory is loaded
A large machine does not need to be filled with maximum quantities of every SKU.
Deep inventory belongs in products that prove they can turn.
6. Payment costs are ignored
Small transaction fees add up across hundreds or thousands of purchases.
Use the actual merchant agreement in the operating model.
7. The machine has no clear support path
Customers become much less forgiving when money is taken automatically and no person is available nearby.
A visible refund and support process should be part of the launch checklist.
8. There is no remote monitoring
Driving to a machine simply to learn that it does not need a refill is avoidable operating cost.
Remote inventory, sales and machine-status data become more valuable with every additional unit.
9. Premium products use the wrong delivery method
If package condition matters, delivery protection belongs in the design specification.
Do not wait for damaged-product refunds to prove that point.
10. The operator assumes automated retail is passive income
The machine removes a cashier from each transaction.
It does not remove purchasing, inventory management, site negotiation, payment reconciliation, service, customer support or compliance.
A good vending business is automated at the transaction level and disciplined at the operating level.
A Detailed Trading Card Vending Machine Profit Example
The following example ties the earlier numbers together.
Assume one machine is installed with:
| Configured equipment and payment preparation | $3,400 |
|---|---|
| Freight and setup allowance | $1,100 |
| Graphics and miscellaneous setup | $500 |
| Equipment-related investment | $5,000 |
| Opening inventory | $3,500 |
| Total initial cash committed | $8,500 |
Sales
The machine sells 15 items per day at an average selling price of $12.
Monthly item volume:
15 × 30 = 450 items.
Monthly revenue:
450 × $12 = $5,400.
Merchandise
Average product cost equals 65% of selling price.
Merchandise cost:
$5,400 × 65% = $3,510.
Merchandise gross profit:
$5,400 − $3,510 = $1,890.
Venue
The placement agreement requires 12% of gross sales.
$5,400 × 12% = $648.
Gross profit remaining:
$1,890 − $648 = $1,242.
Payment
Assume customers buy an average of 1.3 items per transaction.
Approximate monthly transactions:
450 ÷ 1.3 = 346.
Using a planning assumption of 3.2% of revenue plus $0.10 per transaction:
Percentage component:
$5,400 × 3.2% = $172.80.
Transaction component:
346 × $0.10 = $34.60.
Total modeled payment expense:
$207.40.
Remaining:
$1,034.60.
Loss and operating expenses
A 1% shrink/damage allowance equals:
$54.
Connectivity, service allowance, cleaning and ordinary operating expense are modeled at:
$150.
Monthly operating contribution:
$1,034.60 − $54 − $150 = $830.60.
Payback
Simple equipment-related payback:
$5,000 ÷ $830.60 = approximately 6.0 months.
Payback on all initial cash committed:
$8,500 ÷ $830.60 = approximately 10.2 months.
Now stress-test the model
If monthly revenue drops 25%, sales fall to $4,050.
Variable expenses decline, but the machine still has fixed operating costs and capital tied up in equipment.
If merchandise gross margin falls five percentage points at the original $5,400 revenue, contribution loses approximately:
$5,400 × 5% = $270 per month.
If the venue share rises from 12% to 18%, contribution loses:
$5,400 × 6% = $324 per month.
Together, those two changes remove $594 of monthly contribution.
A machine modeled at $831 per month would fall to approximately $237 before considering any secondary effects.
That example explains why trading card vending machines can look highly profitable in one spreadsheet and weak in another.
The assumptions matter.
What I Would Check Before Ordering a Machine
Products
- Exact package dimensions
- Product weight
- Packaging rigidity
- Number of SKUs
- Expected selling prices
- Acceptable drop distance
Capacity
- Expected units sold per day
- Days between refills
- Required depth for bestsellers
- Total inventory value
- Reserve stock requirement
Payment
- Preferred terminal
- Merchant provider
- Contactless requirements
- Recurring payment charges
- Refund process
- Connectivity requirement
Machine
- Delivery mechanism
- Screen size
- Remote management
- Security
- Service access
- Spare-parts plan
Location
- Relevant customer traffic
- Operating hours
- Venue commission
- Machine visibility
- Power and connectivity
- Restocking access
Financial Model
- Expected monthly sales
- Merchandise gross margin
- Payment expense
- Venue expense
- Service cost
- Target payback period
If the project still works after revenue is reduced, margins are stressed and operating expenses are increased, the investment is much easier to defend.
Frequently Asked Questions
Are trading card vending machines profitable in 2026?
Yes. Trading card vending machines can be profitable when merchandise margin, sales volume, venue cost and dispensing reliability are controlled. In the base planning model in this guide, $5,400 of monthly sales produces approximately $831 of monthly operating contribution. That example is an illustration rather than a guarantee of earnings.
How much can a trading card vending machine make per month?
There is no reliable universal monthly revenue figure. Revenue depends on daily transactions, average basket value, product availability, pricing and site quality. A simple model is: transactions per day × average basket × operating days. Fifteen daily purchases at a $12 average basket produce about $5,400 in monthly sales over 30 days.
How much profit can a trading card vending machine make?
Profit depends on what remains after merchandise, payment, venue, shrinkage, maintenance and operating costs. A machine with high sales can still produce little profit if product costs or revenue-share terms are poor. Operators should track contribution per machine rather than judging performance from revenue alone.
How much does a trading card vending machine cost?
Commercial machines generally begin in the low thousands, while larger or heavily customized projects can cost more. Touchscreen size, payment hardware, delivery method, product capacity, branding, software, freight and customization all affect the final price. A project-specific quotation is more useful than a generic base price.
How quickly can a trading card vending machine pay for itself?
Divide the equipment-related investment by monthly operating contribution. A $5,000 equipment investment producing $830 per month has a simple equipment payback of about six months. If monthly contribution is $500, payback is about ten months. Inventory and other startup cash should also be included for a more conservative calculation.
What products work best in a collectible card vending machine?
Sealed booster products, sleeved packs, selected boxes and compatible card accessories are common choices. Graded slabs or higher-value products may justify locker or elevator delivery. The best assortment combines demand, margin, manageable inventory cost and reliable dispensing.
What features should I prioritize when buying a card vending machine?
Reliable product delivery comes first. After that, prioritize cashless payment compatibility, remote sales and inventory monitoring, suitable capacity, easy service access, cabinet security and an internal layout matched to the products. A large screen is useful for merchandising but should not rank above dispensing reliability.
Should I start with one machine or order several?
For an unproven concept, one properly configured pilot is usually the stronger starting point. It allows the operator to test product fit, payment performance, inventory turnover, maintenance requirements and site economics before committing more capital to a larger deployment.
Are Trading Card Vending Machines Worth the Investment in 2026?
For the right product mix and location, yes.
The collectible category remains active, cards are physically well suited to automated retail, and modern machine hardware can handle touchscreen merchandising, cashless payment and remote management without putting a cashier at every transaction.
None of that rescues weak unit economics.
The stronger projects tend to share the same characteristics:
- the operator knows the landed cost of every product;
- the venue is chosen for relevant buyers rather than raw traffic;
- the merchandise gross margin leaves room for automated-retail costs;
- products are tested against the intended delivery mechanism;
- fast inventory is kept in stock;
- slow inventory is reduced before it traps too much cash;
- payment is simple;
- refunds and service have a clear process;
- sales and stock can be monitored remotely;
- the first machine proves the economics before a larger rollout.
In my view, the most important buying decision is not whether to choose the largest screen or the highest published capacity. It is whether the machine has been configured around the merchandise and the operating model.
A sealed booster pack, a boxed collectible and a graded slab do not deserve identical handling simply because all three contain cards.
That is where a configurable manufacturer has an advantage.
Zhongda Smart builds standard and custom automated retail platforms and can adjust product channels, delivery methods, payment preparation, touchscreen presentation, cabinet graphics and remote-management functions around a specific project.
The machine should then be judged by the same commercial standard as any other retail asset:
How much cash does it contribute, how reliably does it operate, and how quickly does the invested capital come back?
Answer those three questions with real operating data and the profitability of trading card vending machines becomes much easier to judge.
Build the Machine Around the Cards You Plan to Sell
Booster packs, sleeved products, boxes and graded slabs do not need the same delivery system. Share your product dimensions, target capacity, payment requirements and preferred machine format with Zhongda Smart for a project-based configuration and quotation.
Request a Project QuoteOEM/ODM · Selected models from 1 unit · Custom product channels · Remote management · Payment integration · Technical support
Sources and Further Reading
- Circana — 2026 market performance update. Circana reported a 14% increase in value sales across its tracked markets during the first half of 2026, with collectibles, fandom and licensing among important demand themes. View the original Circana data.
- Circana — 2025 collectible market report. Circana reported 32% growth in collectibles, with collectible products approaching 19% of tracked toy dollar sales. View the original Circana report.
- PSA — Public Backlog Tracker. The tracker reported approximately 10.9 million active items on August 25, 2026 and documents the large volume of card submissions moving through PSA’s grading operation. View the PSA Backlog Tracker.
- NAMA Foundation — State of Convenience Services Industry Census. The current industry census examines vending, micro markets and other self-service retail formats and their development within convenience services. View the industry census.
Disclaimer
This article is provided for general educational, equipment-planning and commercial-analysis purposes only. Financial examples, revenue figures, profit models, payback periods, cost ranges, payment assumptions and inventory budgets are illustrative. They are not promises, guarantees or representations of actual earnings.
Actual results depend on product sourcing, customer demand, merchandise margin, selling price, machine configuration, site agreement, payment provider, operating expense, taxes, insurance, inventory loss, downtime, maintenance, product availability and other factors.
Published machine specifications and prices can change. Final capacity also depends on product dimensions and the approved internal configuration. Obtain a current project quotation and confirm the final specification before making a purchasing decision.
Operators are responsible for ensuring that every product sold is authentic, lawfully acquired and accurately described. Trademarks, character artwork, logos, copyrighted images, packaging designs and other intellectual property should only be used when the operator has the necessary rights or authorization. A custom vending machine manufacturer should not be represented as an official owner, sponsor or affiliate of a third-party brand unless such authorization exists.
Operators should also confirm all applicable requirements relating to payments, consumer protection, electrical equipment, accessibility, taxation, privacy, product safety, promotions and vending operations before deployment. Randomized, mystery or repackaged products may require additional review.
Nothing in this article constitutes legal, tax, accounting, investment or financial advice.