A solid vending machine business plan comes down to a few hard numbers: how much cash it takes to put a machine into service, how much contribution each sale leaves behind, how much the route costs to operate, and how long it takes to recover the original investment. The machine price matters, but it is rarely the number that makes or breaks the project. Location quality, product margin, payment costs, service time, inventory turnover, downtime, and the dispensing system usually have a larger effect on long-term results. This guide uses one consistent financial model to explain startup costs, monthly cash flow, break-even sales, vending machine ROI, maintenance, machine selection, customization, and scaling. Published industry figures are identified as source data; all financial scenarios are clearly labeled as planning examples rather than earnings claims.
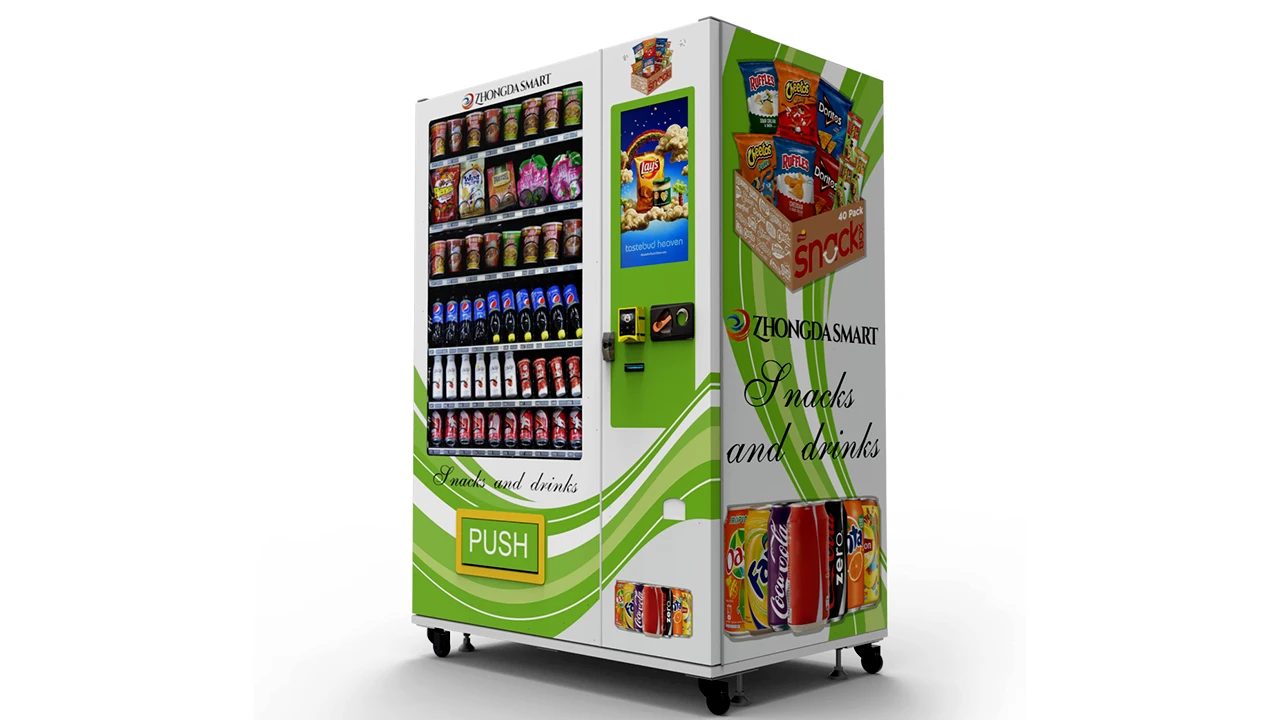
Editorial note: This guide is written from Zhongda Smart's manufacturer-side perspective on machine configuration, product fit, dispensing design, payments, serviceability, and commercial planning. Financial models below are illustrative and should be replaced with actual quotations, product costs, site terms, labor costs, and operating data before capital is committed.
Vending Machine Economics in One Page
A vending machine is a compact retail operation. Revenue comes from transactions, but the number worth watching is the cash left after merchandise, payment fees, location charges, replenishment, maintenance, software, and other operating expenses have been paid.
The basic sales calculation is simple:
Monthly Sales = Transactions per Day × Average Transaction Value × Operating Days
For this guide, one reference machine will be used through most of the calculations. Keeping the assumptions consistent makes it easier to see what changes when sales, costs, or location terms move.
| Planning Variable | Illustrative Assumption |
|---|---|
| Total deployed capital | $5,000 |
| Transactions per day | 20 |
| Average transaction value | $3.25 |
| Operating days | 30 per month |
| Monthly sales | $1,950 |
| Merchandise cost | 42% of sales |
| Location commission | 12% of sales |
| Payment expense | 5% of sales |
| Route and restocking cost | $210 per month |
| Software and connectivity | $35 per month |
| Maintenance reserve | $75 per month |
| Other allocated operating costs | $70 per month |
At 20 transactions per day and $3.25 per transaction, the reference machine generates:
20 × $3.25 × 30 = $1,950 per month
The merchandise, location, and payment assumptions consume 59% of sales. That leaves a 41% contribution margin before monthly route and operating costs.
$1,950 × 41% = $799.50
The model then subtracts $390 in route, software, maintenance, and other operating costs:
$799.50 − $390 = $409.50 monthly operating cash flow
That $409.50 is the figure used later for the base-case payback calculation. It is not an industry average, and it is not a prediction of what a particular machine will earn.
The distinction between published market data and machine-level planning assumptions is important. The Bureau of Labor Statistics series distributed through FRED reported 2025 sectoral output for vending machine operators at approximately $11.027 billion. The NAMA Foundation's 2024–25 industry census separately reported continued growth in convenience services and identified vending as the industry's largest business line by revenue and number of businesses.Neither figure tells an operator what one machine will earn. Location-level economics still decide that.
The five numbers worth knowing before buying a machine
If I were reducing a vending project to one page, I’d want these five figures before approving the equipment:
Total deployed capital: not just the machine invoice.
Contribution margin: what remains from each sales dollar after direct variable costs.
Monthly operating cash flow: what remains after service and recurring machine expenses.
Break-even sales: the monthly revenue needed to cover modeled operating costs.
Simple payback: how many months of modeled cash flow are required to recover the original investment.
Most purchasing mistakes happen when one of those five numbers is replaced with a guess.
What It Really Costs to Put a Vending Machine Into Service
The machine invoice is only one part of vending machine startup cost. A usable budget should follow the machine until it is installed, stocked, connected, tested, and ready to take a payment.
That difference matters because a buyer can purchase a $2,500 machine and still need substantially more than $2,500 to launch it properly.
| Startup Item | Illustrative Amount | What the Cost Covers |
|---|---|---|
| Machine and standard controls | $2,500 | Cabinet, controller, standard dispensing hardware, display, and required core systems |
| Payment hardware and integration | $350 | Reader hardware and configuration required by the project |
| Branding and project configuration | $250 | Artwork, labeling, interface setup, or other project-specific preparation |
| Freight, final delivery, and setup | $700 | Transportation, handling, positioning, and commissioning allowance |
| Opening inventory | $500 | Initial machine load and a small replenishment reserve |
| Spare parts and working capital | $700 | Initial operating buffer for replenishment, service, and unexpected expenses |
| Total | $5,000 | Total cash committed in the reference model |
These are planning figures, not Zhongda Smart prices and not a universal startup budget. Their purpose is to show how an equipment purchase turns into a deployed asset.
Machine price and deployed cost are different numbers
Published equipment prices are useful for initial comparison, but they should not be inserted directly into an ROI model without checking what the listed configuration includes.
As one current reference, the Zhongda Smart Mini Smart Vending Machine lists a public reference price of $1,625. The listed ZD-C-7 configuration includes 36 SKU positions, capacity for up to 300 small boxes, a 7-inch touchscreen, and 4G, Wi-Fi, and LAN connectivity. Zhongda Smart also notes that final pricing depends on the specific quotation and configuration.
A buyer adding different payment hardware, custom artwork, software changes, product-channel adjustments, packaging requirements, or other project work should expect the final quotation to reflect those changes.
Opening inventory deserves its own budget
Inventory is often underestimated because it eventually becomes cost of goods sold. That does not mean it is free at launch.
If the machine holds $500 at product cost and another $500 is kept in reserve for replenishment, $1,000 of cash is tied up before the route reaches normal operating rhythm. Multiply that by ten new machines and the inventory requirement reaches $10,000 even before the business pays for the machines themselves.
This is one of the easiest ways for a growing vending operation to look profitable on paper while still feeling short of cash.
Keep a reserve instead of spending the last dollar on equipment
A business plan that uses every available dollar to purchase hardware has no room for a failed card reader, replacement motor, unexpected freight charge, delayed site launch, or second inventory order.
The reserve does not need to sit unused forever. It simply prevents routine operating problems from becoming financing problems during the first months of operation.
What Changes the Price of a Vending Machine
Two vending machines with similar outside dimensions can have very different production costs. Cabinet size is only one variable. Cooling systems, dispensing mechanisms, screen size, payment hardware, control architecture, product sensors, communications equipment, locks, outdoor protection, and customization can all change the bill of materials and the engineering work behind the machine.
That is why a useful quotation starts with the product being sold rather than a photograph of a cabinet.
| Configuration Change | Why Cost Can Change | When the Extra Cost May Be Justified |
|---|---|---|
| Refrigeration | Adds cooling hardware, insulation, airflow design, sensors, electrical load, and temperature controls | Products require controlled cabinet temperature |
| Elevator delivery | Adds motors, rails, sensors, controls, and a more complex delivery sequence | Products are fragile, premium, irregular, or unsuitable for a free fall |
| Large touchscreen | Changes display hardware, mounting, controller requirements, interface design, and power demand | Large visual merchandising or a more complex customer interface is commercially useful |
| Cash plus cashless payment | Adds validators, coin equipment, readers, harnesses, communication protocols, and integration work | Customer payment behavior supports multiple methods |
| Custom cargo lanes | May require revised spacing, motors, spirals, belts, pushers, lockers, or testing | Standard lanes do not fit the actual packages reliably |
| Custom cabinet dimensions | Can affect sheet-metal drawings, internal layout, tooling, packing, and production setup | The installation footprint or merchandise requires a nonstandard form factor |
| Outdoor configuration | May require stronger enclosure design, sealing, environmental protection, drainage, cooling strategy, and security changes | The installation conditions demand additional protection |
| Remote telemetry | Adds communication hardware, network setup, software functions, and backend integration | Remote inventory and machine status can reduce service cost |
| Custom software | Requires interface, payment, reporting, API, or workflow development and testing | The operating model cannot be supported by the standard software configuration |
A 60-slot specification does not always mean 60 usable SKUs
Selection count is easy to compare on a brochure, but the usable layout depends on the merchandise.
A wide package may take the space of two standard lanes. A high-volume product may deliberately use three lanes because one lane would sell out between visits. A tall box may reduce the number of usable shelf levels. A flexible pouch may need a different dispensing method from a rigid box of similar dimensions.
For a custom vending project, the quotation becomes much more accurate once the manufacturer has five basic inputs: product dimensions, product weight, required SKU count, dispensing requirements, and payment configuration. Cabinet graphics can usually be finalized later. Mechanical fit cannot.
Real product samples are more useful than a product category
"Cosmetics," "electronics," "snacks," and "collectibles" are broad categories. They do not describe how a particular package behaves inside a machine.
A manufacturer evaluating product fit should ideally know:
Length, width, and height of each package
Weight
Packaging material and rigidity
Whether the item can tolerate a drop
Preferred orientation inside the lane
Required quantity per SKU
Whether the item is temperature-sensitive
Whether the package has loose contents or an uneven center of gravity
A small difference in package geometry can be more important than a large difference in cabinet dimensions.
Choosing the Machine Before Building the Financial Model
The lowest-cost machine is not automatically the lowest-cost way to sell a product. Dispensing failures, broken merchandise, frequent stockouts, difficult servicing, and limited payment support can erase the initial purchase savings.
For this comparison, I’m prioritizing product fit, dispensing reliability, capacity, serviceability, and the amount of operating complexity each machine adds.
| Machine Architecture | Typical Product Fit | Financial Advantage | Cost or Operating Trade-Off |
|---|---|---|---|
| Spiral vending | Packaged snacks, boxes, bottles, and predictable package shapes | Simple, flexible, widely understood dispensing format | Not every fragile or irregular package releases cleanly |
| Belt or conveyor delivery | Products that benefit from controlled forward movement | Can handle products that are awkward in a conventional spiral | More moving components and configuration work |
| Elevator delivery | Fragile merchandise, meals, desserts, electronics, premium packaged goods | Reduces drop distance and product impact | Higher hardware complexity and service requirements |
| Locker vending | Large, irregular, reserved, or individually compartmentalized items | Product shape matters less than compartment size | Each locker consumes physical capacity |
| Compact vending machine | Small boxes, personal-care items, accessories, compact retail products | Uses less floor space and can provide high SKU density for small merchandise | Limited fit for bulky products |
| Refrigerated vending | Beverages, selected foods, and temperature-sensitive products | Allows product categories that cannot be stored in an ambient cabinet | Higher power demand and more maintenance points |
Zhongda Smart's current vending machine configurations include compact machines, food and beverage models, elevator systems, locker machines, outdoor units, collectible vending machines, and other specialty formats. The useful comparison is not which cabinet has the longest feature list. It is which configuration supports the intended product without paying for functions that the operation does not need.
Capacity should be planned around sales velocity
A machine may technically fit 300 items, but total item count tells only part of the story.
Imagine one SKU sells eight units a day while another sells one unit every four days. Giving both products equal lane capacity creates two problems at once: the fast seller stocks out and the slow seller traps inventory.
Capacity should be allocated according to expected movement. Fast products may need duplicate lanes or deeper storage. Slow products may deserve a single lane or may not deserve space at all.
Do not pay for complexity without a commercial reason
An elevator is useful when it solves a product-handling problem. A large screen is useful when the interface, advertising, or assortment needs it. Refrigeration is useful when the merchandise requires it.
Complexity that does not improve revenue, product protection, service efficiency, compliance, or customer experience becomes another component to purchase and maintain.
Location and Product Economics
Hardware can improve reliability and reduce transaction friction, but it cannot create demand where very little exists. A machine still needs enough qualified purchase opportunities to cover its capital and operating costs.
Count relevant traffic, not just people
A busy site can perform poorly when visitors move quickly past the machine, have several nearby alternatives, or have little reason to buy the products inside it.
A quieter site can perform well when people remain nearby for long periods, the machine is visible, the merchandise solves an immediate need, and purchasing alternatives are limited.
The useful location questions are practical:
How many potential customers regularly pass the machine?
How long do they remain near it?
Can they easily buy the same product elsewhere?
Is the machine visible before the customer needs the product?
Is the machine accessible during the site's actual operating hours?
Can replenishment staff reach it without wasting excessive time?
What rent, commission, or revenue share does the site require?
Conversion turns traffic into a usable financial assumption
Suppose a site produces 400 relevant viewing opportunities per day and 5% convert into a transaction:
400 × 5% = 20 transactions per day
At the $3.25 average sale used in the reference model:
20 × $3.25 × 30 = $1,950 monthly sales
Now consider a site with 220 relevant viewing opportunities but an 8% conversion rate:
220 × 8% = 17.6 transactions per day
The second location has much lower traffic, yet it still comes close to the transaction volume of the first because a larger share of people buy.
Actual conversion should be measured after installation rather than assumed indefinitely. Early data may justify a different product mix, new pricing, better signage, a more visible machine position, or a different location altogether.
Location commission should be evaluated in dollars, not just percentages
The reference model uses a 12% location commission:
$1,950 × 12% = $234 per month
Raise the commission to 18% without changing sales:
$1,950 × 18% = $351 per month
The difference is $117 every month, or $1,404 over twelve months before considering any change in sales.
A prestigious location is not automatically profitable at any commission rate. Site terms have to fit inside the machine's contribution margin.
Product margin belongs beside location quality
Revenue can look healthy while gross contribution remains thin. Start with each SKU.
If a product sells for $3.25 and costs $1.37, merchandise cost is roughly 42%:
$3.25 − $1.37 = $1.88 gross merchandise profit
Now subtract an illustrative 12% site commission of $0.39 and 5% payment expense of about $0.16:
$3.25 − $1.37 − $0.39 − $0.16 = approximately $1.33 contribution before route and fixed operating costs
That $1.33 is a more useful number than the original $1.88 because it is closer to what the transaction contributes toward servicing the machine and recovering the investment.
A high margin percentage does not rescue a product that barely sells
A slow SKU occupies physical space and cash. A fast SKU can earn more contribution from the same lane even with a lower percentage margin.
For product planning, track contribution dollars per lane in addition to gross margin percentage. That calculation gives slow merchandise fewer places to hide.
Monthly Cash Flow: A Working Model
The reference model produces $1,950 in monthly sales. The next step is to follow those sales through the machine's cost structure.
| Monthly Item | Assumption | Amount | Cash Remaining |
|---|---|---|---|
| Gross sales | 20 transactions/day × $3.25 × 30 days | $1,950.00 | $1,950.00 |
| Merchandise cost | 42% of sales | -$819.00 | $1,131.00 |
| Location commission | 12% of sales | -$234.00 | $897.00 |
| Payment expense | 5% planning assumption | -$97.50 | $799.50 |
| Route and restocking | Allocated monthly cost | -$210.00 | $589.50 |
| Software/connectivity | Planning allowance | -$35.00 | $554.50 |
| Maintenance reserve | Planning allowance | -$75.00 | $479.50 |
| Other allocated operating costs | Administrative and miscellaneous allowance | -$70.00 | $409.50 |
| Modeled monthly operating cash flow | $409.50 |
The model deliberately stops before taxes, financing, depreciation, owner distributions, and business-level overhead that may not belong to one specific machine. Those items should be added according to the actual business structure.
Do not confuse sales, gross profit, and operating cash
The reference machine reports $1,950 in sales but only $409.50 in modeled operating cash flow.
A statement such as "this machine makes $1,950 a month" is therefore incomplete. It may describe sales while saying nothing about what remains after products and operating expenses are paid.
When comparing two vending opportunities, compare them at the same level:
Sales against sales
Gross profit against gross profit
Contribution against contribution
Operating cash against operating cash
Mixing those measures creates misleading comparisons.
Owner labor should not disappear from the model
An owner may personally restock machines during the first year and choose not to draw a separate wage for every service visit. The time still has an economic value.
Count hours spent on:
Driving
Loading inventory
Restocking
Cleaning
Cash collection
Reconciliation
Location communication
Purchasing
Vending machine repair coordination
Accounting and administration
If those hours are ignored, a labor-heavy machine can appear more profitable than a lower-maintenance machine that produces slightly less revenue.
Break-Even, Payback, and Vending Machine ROI
Break-even, payback, and ROI answer different questions. They should not be used interchangeably.
Monthly operating break-even
The reference machine retains 41% of each sales dollar after merchandise, location commission, and payment expense.
Its monthly route and other operating costs are $390.
The operating break-even equation is:
Break-Even Sales = Monthly Operating Costs ÷ Contribution Margin Ratio
$390 ÷ 41% = approximately $951.22 per month
At an average sale of $3.25:
$951.22 ÷ $3.25 = about 293 transactions per month
Across 30 operating days:
293 ÷ 30 = about 9.8 transactions per day
Under the reference assumptions, the machine needs roughly ten daily transactions to cover the modeled monthly operating costs. That does not yet recover the original $5,000 investment.
Break-even including a capital-recovery target
Suppose the business wants the $5,000 investment recovered over 24 months.
That requires:
$5,000 ÷ 24 = $208.33 of monthly capital recovery
Add that amount to the $390 monthly operating cost:
$390 + $208.33 = $598.33
At a 41% contribution margin:
$598.33 ÷ 41% = approximately $1,459.34 in monthly sales
At $3.25 per transaction:
$1,459.34 ÷ $3.25 ÷ 30 = approximately 15 transactions per day
That is a useful location-screening number. If a proposed site has little chance of producing 15 daily transactions, a 24-month capital recovery target is difficult under these assumptions.
Simple payback period
The reference model generates $409.50 in monthly operating cash flow.
Simple Payback = Initial Investment ÷ Monthly Operating Cash Flow
$5,000 ÷ $409.50 = approximately 12.2 months
Simple payback is easy to understand, but it has limitations. It does not measure the time value of money, resale value, taxes, financing structure, or cash generated after the original investment has been recovered.
Simple annual vending machine ROI
Annualized operating cash flow in the base model is:
$409.50 × 12 = $4,914
A simple annual return calculation is:
Simple ROI = Annual Operating Cash Flow ÷ Initial Deployed Capital × 100
$4,914 ÷ $5,000 × 100 = approximately 98.3%
That percentage is an output of the illustrative model, not a typical vending machine return and not a performance promise. Actual returns can be much lower, negative, or higher depending on real sales and costs.
A credible vending machine business plan should show the assumptions beside the ROI percentage. A return figure without its revenue, merchandise cost, commission, service cost, and capital assumptions is difficult to evaluate.
Stress-Testing the Business Plan
The base case should not be the only case. A machine can miss its sales target, product prices can rise, the site can ask for a larger share, or servicing can take longer than expected.
Stress testing shows which assumptions matter most before the money is spent.
| Scenario | Modeled Monthly Cash Flow | Simple Payback | What Changed |
|---|---|---|---|
| Base case | $409.50 | 12.2 months | Original reference assumptions |
| Sales fall 20% | $249.60 | 20.0 months | Monthly sales fall from $1,950 to $1,560; other percentage costs move with sales |
| Merchandise cost rises from 42% to 47% | $312.00 | 16.0 months | Five percentage points of product margin disappear |
| Location commission rises from 12% to 18% | $292.50 | 17.1 months | Site cost rises by $117 per month |
| Payment expense rises from 5% to 7% | $370.50 | 13.5 months | Two percentage points of revenue are added to payment cost |
| Route cost rises by $90 per month | $319.50 | 15.6 months | Extra driving, labor, or replenishment time |
| Average sale rises from $3.25 to $3.50 at the same transaction count | $471.00 | 10.6 months | Monthly sales rise to $2,100 while the percentage cost structure remains unchanged |
The table makes the economics easier to see. A six-point increase in location commission stretches modeled payback from 12.2 months to 17.1 months. A five-point increase in merchandise cost pushes it to roughly 16 months. A 20% sales decline stretches payback to about 20 months.
Those changes are much larger than the effect of saving a few hundred dollars on the machine purchase.
Location quality usually deserves more attention than a small equipment discount
Suppose one supplier quotation is $300 cheaper. That looks meaningful during procurement.
Now compare it with a machine that underperforms the sales plan by $390 per month. The $300 purchase saving is consumed before the first month is over.
This does not mean equipment price should be ignored. It means equipment price should be compared with the value the machine is expected to produce and the operating burden it creates.
Build a downside case that is uncomfortable but plausible
A weak business plan asks what happens when everything works. A useful one also asks what happens when sales are 20% lower, product costs rise, one major SKU is unavailable, the machine needs an extra service visit, or a repair removes it from service for several days.
If the project still preserves adequate cash and working capital, the business has room to adjust. If a modest change turns cash flow negative, the initial assumptions need another look.
Payments, Inventory, and Working Capital
Three parts of vending operations regularly consume more cash than expected: payment acceptance, inventory, and route replenishment.
Cashless payment belongs in the financial model
Cashless payment is no longer a cosmetic upgrade. It affects customer convenience, machine hardware, connectivity, processing expense, reconciliation, and transaction data.
The Federal Reserve Financial Services 2026 Diary of Consumer Payment Choice reported that cash represented 14% of payments made by surveyed consumers, while four out of five had used cash during the previous 30 days.The findings support a practical conclusion: electronic payment is important, but cash has not disappeared.
A separate Federal Reserve payments study reported 236.6 billion noncash payments in 2024, with cards accounting for more than three quarters of noncash payments by number.
Those figures should not be turned into a rule that every machine needs the same payment configuration. Product value, site characteristics, customer behavior, transaction size, processing agreement, connectivity, and cash-handling cost all matter.
| Payment Cost | Cashless | Cash |
|---|---|---|
| Hardware | Reader, controller integration, communications hardware | Bill validator, coin mechanism, change equipment where used |
| Transaction cost | Processor and service fees may apply | No electronic processing fee, but physical handling is not free |
| Labor | Lower physical collection burden | Collection, counting, reconciliation, and change management |
| Connectivity | Usually required for online authorization and remote services | Not required for accepting physical cash itself |
| Customer friction | Depends on reader reliability and supported methods | Depends on whether customers carry suitable cash and whether change is available |
The working-capital trap
A vending business can report accounting profit and still consume cash during expansion.
Suppose five new machines each require $500 in opening inventory. Another $2,500 is tied up before those products are sold.
If replenishment stock is also held centrally, the cash requirement is higher. If electronic transactions settle after the inventory was purchased, timing creates another short gap between cash going out and cash coming back.
Expansion plans should therefore include:
Opening machine inventory
Reserve stock
Supplier payment terms
Payment settlement timing
Expected inventory turnover
Spoilage or obsolescence risk
Measure inventory by days of supply
Suppose one lane contains 12 units and sells two units per day:
12 units ÷ 2 units per day = 6 days of supply
If the route visits every seven days, the lane is likely to be empty before the next scheduled service.
The response could be to increase capacity, duplicate the SKU, shorten the service interval, or change the assortment. The right answer depends on how much additional contribution each option creates compared with its service cost.
Slow inventory has a carrying cost even when it does not expire
A product does not have to spoil to be expensive. Merchandise sitting in a machine for months occupies space and ties up cash that could be used for faster-selling items.
For each SKU, track:
Units sold
Sales dollars
Product cost
Contribution dollars
Days of supply
Stockouts
Damage or spoilage
Lane space occupied
The strongest assortment is rarely the one with the most products. It is the one that makes productive use of the machine's limited selling space.
Maintenance, Downtime, and Vending Machine Repair
A vending machine does not need to break often for downtime to matter financially. A single failed component can stop payment, prevent dispensing, disable refrigeration, or make the customer interface unusable.
Maintenance should therefore appear in the original business plan rather than being added after the first repair.
There is no responsible universal repair percentage
Maintenance cost depends on machine architecture, component quality, usage, age, environment, refrigeration, payment equipment, availability of spare parts, and technician access.
A simple ambient machine and a refrigerated elevator machine do not have the same number of components or the same service profile.
Instead of applying an unsupported industry percentage, the reference model uses a $75 monthly maintenance reserve. The actual reserve should be replaced with real service history once enough operating data exists.
Downtime has a revenue cost and a service cost
Assume the reference machine averages:
$1,950 ÷ 30 = $65 in daily sales
Its contribution after merchandise, location commission, and payment expense is 41%:
$65 × 41% = $26.65 of daily contribution before monthly operating costs
Three full days of complete downtime therefore put approximately:
$26.65 × 3 = $79.95 of contribution at risk
That figure does not include the replacement part, service labor, travel, refunds, or the possibility that customers stop checking the machine after repeated failures.
Serviceability should be evaluated before purchase
A machine may eventually require attention to components such as:
Payment readers
Bill validators and coin systems
Touchscreens
Controllers and power supplies
Spiral motors or conveyor components
Elevator motors and position sensors
Door locks and switches
Cooling fans
Compressors and refrigeration components
Network communication hardware
Before ordering, ask how common replacement parts are identified, how technical support works, what diagnostics are available, what the warranty covers, and which parts can be kept locally.
I’d choose a machine that can be diagnosed and returned to service quickly over a more decorative cabinet whose internal components are difficult to access.
Preventive maintenance should follow the actual machine
There is no credible universal statement such as "every vending machine needs maintenance every X days." Refrigeration, payment devices, mechanical assemblies, filters, sensors, and cleaning requirements differ.
Use the machine documentation and component requirements to build the preventive schedule. Once the machine is operating, service records should replace generic assumptions.
When Custom Vending Equipment Makes Financial Sense
Customization is financially useful when it solves a specific selling or operating problem. It is not automatically valuable because it makes a machine look more advanced.
Functional customization may improve:
Product fit
Dispensing reliability
Capacity
Payment compatibility
Inventory control
Remote diagnostics
Temperature management
Brand presentation
Customer interface
Service access
Start with merchandise before discussing cabinet appearance
In a custom project, product dimensions and dispensing behavior should be settled before expensive cosmetic details.
A practical specification package includes:
Product photographs
Length, width, and height
Weight
Package material
Number of SKUs
Expected quantity per SKU
Target total capacity
Temperature requirements
Preferred payment methods
Network requirements
Site power requirements
Interface and language requirements
Branding files
Zhongda Smart's published vending machine manufacturing process describes specification confirmation before mechanical engineering, sheet-metal production, assembly, payment and software integration, product testing, aging tests, quality control, and final packaging. That order reflects an important procurement principle: the machine should be engineered around what it needs to sell and how it needs to operate.
Sample testing is more valuable than theoretical fit
A package can fit inside a lane and still dispense badly.
Problems may come from:
Excess friction against neighboring packages
A flexible pouch bending during movement
A heavy item shifting a spiral
A narrow box rotating in the lane
A fragile package landing badly
An uneven product failing to trigger a delivery sensor consistently
If the product is commercially important, testing real samples before production is more meaningful than approving the layout from dimensions alone.
Custom features need a payback reason
Suppose an elevator configuration adds $900 to a project. The correct question is not whether $900 is expensive in isolation.
The real questions are:
Does it allow the machine to sell products that could not otherwise be sold reliably?
Does it reduce product damage and refunds?
Does it support a higher-value assortment?
Does it improve customer confidence in receiving fragile merchandise?
If the answer is no, the extra mechanism may simply add capital and maintenance complexity. If the answer is yes, the higher machine cost may be economically justified.
A custom machine should not be overbuilt before the retail concept is proven
For a new product concept with uncertain demand, I’d keep the first configuration as simple as the merchandise allows. Expensive cosmetic work, oversized displays, and deeply customized software can wait until the machine proves that customers will buy.
The exception is a project where the brand presentation or customer interface is itself central to the concept. Even then, product fit and dispensing reliability still come first.
How to Evaluate a Vending Machine Manufacturer
A commercial machine purchase often creates a relationship that continues long after delivery. Payment configuration, replacement parts, firmware, product-channel changes, technical questions, and repeat orders can all bring the buyer back to the manufacturer.
Supplier comparison should therefore go beyond cabinet price.
| Procurement Area | What to Verify | Financial Reason |
|---|---|---|
| Product fit | Actual merchandise can be matched to the dispensing system | Poor fit leads to jams, refunds, and lost sales |
| Sample testing | Real products can be tested before production when required | Reduces configuration mistakes |
| Payment integration | Required readers and protocols are supported | Avoids deployment delays and additional integration cost |
| Quality control | Assembly, inspection, functional testing, and final checks are defined | Helps reduce avoidable delivery and startup problems |
| Spare parts | Parts can be identified, ordered, and stocked | Shorter downtime protects sales |
| Technical documentation | Manuals and service information are available for the ordered configuration | Improves repair efficiency |
| Software functions | Required sales, inventory, alert, and remote-management functions are confirmed | Prevents paying for assumptions that the software does not support |
| Customization scope | OEM and ODM changes are defined before production | Controls rework and quotation changes |
| Warranty process | Coverage, evidence requirements, replacement-part process, and support channels are understood | Clarifies post-delivery responsibilities |
| Repeat production | The supplier can reproduce the approved configuration consistently | Important when moving from a sample to a larger fleet |
Where Zhongda Smart fits
Zhongda Smart is worth considering when the project requires more than a standard off-the-shelf cabinet. The company's current product and factory materials describe OEM and ODM work across compact vending machines, snack and beverage systems, refrigerated machines, elevator delivery, lockers, specialty retail equipment, payment integration, remote management, and custom product-channel configurations.
According to Zhongda Smart's published manufacturing profile, the company operates approximately 20,000 square meters of working space, employs more than 400 people, maintains an engineering team of more than 10 people, and lists annual production capacity of 10,000 units. These are company-published figures and should be treated as such; buyers conducting formal procurement should request the specific documents, certifications, samples, drawings, and commercial terms required for their project.
That distinction matters. A manufacturer should not be selected because a website uses broad claims such as "best quality." Procurement decisions are stronger when they are based on things that can be checked: machine drawings, product test results, payment compatibility, component specifications, sample approval, quality-control procedure, warranty terms, and spare-parts support.
The cheapest quotation can create the most expensive operating problem
Imagine two machines:
Machine A costs $2,300 but requires an extra $120 service visit every month.
Machine B costs $2,700 but avoids that additional monthly visit.
Machine A saves $400 upfront.
After four months, four extra $120 service visits have cost $480.
The cheaper purchase has already become the more expensive operating choice under that example.
This is why I’d rank serviceability, product fit, and operating compatibility ahead of a small difference in initial machine price.
Scaling From One Machine to a Route
One profitable machine does not automatically mean ten machines will be ten times as profitable. Growth changes inventory needs, route planning, labor, spare-parts requirements, cash management, and service logistics.
Route density changes the economics
Consider two ten-machine routes.
Route A averages 20 minutes of travel between stops.
Route B averages eight minutes.
For nine travel legs:
Route A: 9 × 20 minutes = 180 minutes
Route B: 9 × 8 minutes = 72 minutes
The difference is 108 minutes before parking, loading, restocking, cleaning, cash handling, or repairs are considered.
A slightly lower-revenue machine located near five other machines can therefore be economically attractive compared with a distant machine that requires a dedicated trip.
Track contribution per service hour
Revenue per machine is useful, but it does not measure the labor required to produce that revenue.
A stronger route dashboard includes:
Sales per machine
Contribution per machine
Operating cash flow per machine
Contribution per service hour
Sales per visit
Average service time
Stockouts
Refunds
Machine uptime
Repair incidents
Inventory turns
Remote management earns its keep by changing decisions
A dashboard has little financial value if nobody changes the route based on its information.
Remote data becomes useful when it answers questions such as:
Which machine needs inventory today?
Which machine can wait another two days?
Which SKU is close to selling out?
Which product has stopped moving?
Did payment volume suddenly fall?
Is a machine reporting a fault?
How much inventory should be loaded before the route leaves?
If reliable data removes six unnecessary service stops from a month, the value comes from the labor and travel avoided, not from having a dashboard on a screen.
Standardization becomes more valuable as the fleet grows
Ten machines built around ten unrelated control systems, payment devices, locks, motors, and spare-part families create more training and inventory complexity than ten machines sharing common components.
Standardization can reduce:
Spare-part variety
Technician learning time
Diagnostic uncertainty
Software variation
Payment-system variation
Inventory required for emergency repairs
It should not be taken too far. A specialty product still deserves the correct dispensing system. The aim is to remove unnecessary variation, not force every product into the same machine.
Growth consumes working capital before it produces mature cash flow
If each new machine requires $5,000 of total deployed capital under the reference model, adding five machines means another $25,000 of capital before allowing for central inventory, staff expansion, storage, or additional transportation.
That is why expansion should follow evidence.
A machine has stronger grounds for replication when it has demonstrated:
Stable transaction volume
Healthy contribution margin
Manageable replenishment requirements
Acceptable downtime
Repeatable product demand
Reasonable capital recovery
Buying more machines does not fix a weak product-location combination. It multiplies it.
Vending Machine Business Plan Checklist
A vending business plan does not need to be filled with pages of broad market language. It needs assumptions that can later be compared with actual machine data.
1. Define the product before the machine
What exact products will be sold?
What are the package dimensions and weights?
How many SKUs are required?
Which items are expected to sell fastest?
Are products fragile or temperature-sensitive?
How much opening inventory is required?
2. Define the location economics
How many relevant customer opportunities exist each day?
What daily transaction count is realistic?
What site commission or rent applies?
How easy is replenishment access?
What competing purchase alternatives are nearby?
Is the machine visible and easy to reach?
3. Define the equipment specification
Spiral, belt, elevator, locker, or another dispensing system
Ambient or refrigerated cabinet
Number of practical product lanes
Target capacity per high-volume SKU
Screen requirements
Payment configuration
Connectivity
Remote-management requirements
Branding
Power requirements
4. Build the deployed-cost budget
Machine
Payment hardware
Customization
Freight and handling
Final delivery
Installation and commissioning
Opening inventory
Spare parts
Working capital
5. Build the monthly operating model
Transactions per day
Average transaction value
Monthly sales
Merchandise cost percentage
Payment expense
Location commission
Route labor
Transportation
Connectivity and software
Maintenance reserve
Insurance and administrative allocation
Spoilage or shrinkage allowance where relevant
6. Calculate break-even before calculating the upside
Record:
Monthly operating break-even sales
Break-even transactions per day
Sales required for the desired capital-recovery period
Base-case cash flow
Downside cash flow
Simple payback
Simple annual ROI
7. Plan the service process
Who restocks the machine?
How often is the machine expected to be visited?
Which replacement parts should be kept available?
Who handles vending machine repair?
How is a failed payment handled?
How are customer refunds handled?
How quickly can a failed machine be diagnosed?
8. Compare the plan with actual results after launch
| Metric | Original Plan | Actual Result | What a Variance May Mean |
|---|---|---|---|
| Transactions per day | Forecast | Measured | Demand, visibility, assortment, or location assumption may need revision |
| Average transaction value | Forecast | Measured | Product mix or pricing differs from plan |
| Merchandise cost | Budget | Measured | Sourcing or product mix is changing margin |
| Stockouts | Target | Measured | Capacity or service frequency may be too low |
| Slow inventory | Target | Measured | Lane space and working capital may be poorly allocated |
| Service time | Forecast | Measured | Route cost may be understated |
| Downtime | Target | Measured | Maintenance, parts, or machine configuration may require attention |
| Monthly operating cash | Forecast | Measured | Rebuild the ROI model using actual operating data |
Do not rewrite the original forecast after launch to make it look accurate. Keep the forecast and compare it with reality. The difference between the two is where the useful information lives.
Frequently Asked Questions
How much does it cost to start a vending machine business?
Startup cost depends on the machine, payment hardware, customization, freight, installation, opening inventory, spare parts, and working capital. The machine invoice should not be treated as the complete startup budget. In the illustrative model used in this guide, a $2,500 machine becomes a $5,000 total deployed project after payment equipment, configuration, delivery, inventory, and operating reserves are included. That figure is an example, not an industry average.
How profitable can one vending machine be?
There is no reliable universal profit number for one vending machine. Monthly cash flow depends on transaction volume, selling price, product cost, location commission, payment expenses, route labor, transportation, software, maintenance, and other operating costs. The useful calculation is machine-level operating cash flow after those expenses rather than gross sales alone.
How do you calculate vending machine ROI?
A simple vending machine ROI calculation divides annual operating cash flow by total deployed capital and multiplies the result by 100. Total deployed capital should include the machine, payment hardware, freight, installation, opening inventory, customization, and other startup costs. ROI should always be shown with the assumptions used to calculate it.
How long does a vending machine take to pay for itself?
Simple payback is calculated by dividing total deployed capital by average monthly operating cash flow. In the reference model used in this guide, $5,000 of deployed capital divided by $409.50 of modeled monthly cash flow produces a simple payback of about 12.2 months. Actual payback can be shorter, longer, or may never occur if the machine does not generate enough cash.
What type of vending machine should I choose?
Start with the products. Conventional spiral systems work well for many predictable packages. Elevator delivery can be useful for fragile or premium products. Locker systems suit large or irregular merchandise, while compact machines can provide efficient SKU density for small packaged items. Refrigeration should be selected when the merchandise requires temperature control. Product dimensions and real sample testing should guide the final configuration.
Should a vending machine accept cash and cashless payments?
The payment mix should match the intended customers, transaction value, connectivity, and operating costs. Cashless payment can reduce purchase friction and physical cash handling, but it introduces reader, connectivity, and processing costs. Cash avoids electronic processing expense but requires collection, reconciliation, change management, and additional hardware. Compare the full operating cost rather than assuming either method is free.
How much should be budgeted for vending machine repair?
There is no responsible universal repair percentage. Maintenance depends on machine type, refrigeration, payment hardware, usage, age, environment, component quality, spare-parts availability, and service access. Include a monthly maintenance reserve in the initial business plan, then replace the planning allowance with actual service data once the machine has enough operating history.
When does a custom vending machine make financial sense?
Customization makes financial sense when it improves product fit, dispensing reliability, capacity, payment compatibility, temperature control, customer interface, remote management, branding, or servicing enough to justify its additional cost. Custom features that do not improve revenue, reliability, product protection, or operating efficiency may simply lengthen the payback period.
Build the Business Around Unit Economics, Not the Cabinet
A vending machine is easy to understand as hardware and harder to understand as a business asset. The cabinet can be photographed, quoted, and compared in a day. Location quality, inventory turns, payment costs, route efficiency, downtime, and customer demand reveal themselves over time.
That is why the machine should be selected after the operating model has been defined.
Start with the merchandise. Confirm package dimensions, weight, capacity, temperature needs, payment requirements, and expected sales velocity. Then choose the dispensing system that can handle those products without unnecessary complexity.
Build the financial model using total deployed capital rather than the factory invoice. Include opening inventory and enough working capital to operate through the first replenishment and repair cycles.
At the location level, focus on daily transactions, average sale, contribution margin, site commission, and service cost. At the route level, add travel time, inventory logistics, spare parts, software, and labor.
The reference model in this guide shows why small changes matter. A six-point increase in site commission stretches simple payback from about 12 months to more than 17 months. A 20% reduction in sales pushes it to roughly 20 months. Those changes overwhelm a modest discount on the original machine.
If I were choosing for a new project, I’d approve equipment only after five things were written down: the actual products, total deployed cost, break-even transaction count, downside cash-flow case, and service plan.
For projects that require product-specific engineering, Zhongda Smart manufactures standard and customized vending systems covering compact cabinets, food and beverage vending, elevator delivery, lockers, refrigeration, payment integration, remote-management functions, and specialty retail configurations. The most productive conversation with any manufacturer starts with the product samples and operating requirements, not with a request for the largest feature list.
A machine that sells the right product, in the right location, with manageable operating costs can be a productive retail asset. A machine chosen before those numbers are understood is simply an equipment purchase.
Data Sources and References
Bureau of Labor Statistics data via Federal Reserve Bank of St. Louis FRED — Sectoral Output for Vending Machine Operators, 2025. The series reported 2025 sectoral output of 11,026.939 million dollars and was updated in June 2026. View the official FRED data series.
NAMA Foundation — 2024–2025 State of Convenience Services Industry Census. The 2025 release reported $31.1 billion in convenience-services revenue and identified vending as the largest business line by revenue and number of businesses within the study. View the NAMA Foundation release.
Federal Reserve Financial Services — 2026 Diary of Consumer Payment Choice. The 2026 findings reported that cash represented 14% of payments among surveyed consumers and that four out of five consumers had used cash during the previous 30 days. View the 2026 payment findings.
Federal Reserve Board — 2025 Federal Reserve Payments Study, initial findings released July 2026. The study reported 236.6 billion noncash payments in 2024 and stated that cards accounted for more than three quarters of noncash payments by number. View the official Federal Reserve release.
Manufacturer information: Zhongda Smart product specifications, public reference prices, manufacturing information, machine features, company figures, and customization descriptions in this article are based on publicly available Zhongda Smart pages checked during preparation of this guide. Specifications, payment configurations, software functions, certifications, freight costs, customization options, production details, and commercial terms may change. Project-specific requirements should be confirmed in the final technical specification and quotation.
Disclaimer
This article is provided for general business planning and educational purposes. All machine-level revenue, cost, cash-flow, break-even, payback, and ROI examples are illustrative calculations based on the assumptions shown in the article. They are not promises, guarantees, investment advice, legal advice, tax advice, accounting advice, or forecasts of future earnings. Actual results depend on machine configuration, product demand, selling prices, product costs, site terms, payment expenses, inventory losses, labor, transportation, maintenance, financing, taxes, downtime, and other operating conditions. Published market and payment statistics are attributed to their original sources and should not be interpreted as projections for an individual vending machine. Buyers and operators should verify applicable electrical, payment, product, food-handling, insurance, accessibility, installation, safety, tax, and other requirements relevant to the specific project and seek qualified professional advice where appropriate.