A refrigerated drink vending machine does not normally draw its rated wattage every minute of the day. For early budgeting, I’d use roughly 150–300 average watts as a practical placeholder for a modern refrigerated machine, then replace that estimate with a verified kWh/day figure for the exact configuration. Published Department of Energy data for a 30 ft³ refrigerated beverage machine shows example daily consumption levels of 3.23, 3.71, and 3.99 kWh/day, equal to about135, 155, and 166 continuous average watts. That distinction matters. A specification may show 580W or more because the compressor, fans, display, payment hardware, and dispensing system can operate at the same time. Monthly electricity cost, however, depends on energy consumed across the entire day rather than the largest watt number printed on the product sheet.
How Much Power Does a Drink Vending Machine Actually Use?
If the only information available is a product brochure, the temptation is to look for one watt number and treat it as the machine's permanent electrical load. That is rarely the right way to estimate the running cost of a refrigerated vending machine.
Cooling equipment cycles. The compressor starts when the cabinet needs additional cooling and stops after the temperature control is satisfied. Fans may follow their own control logic. A touchscreen can stay active while refrigeration is idle. Payment hardware may consume a small amount of power around the clock. Dispensing motors operate for only a few seconds during each sale.
The result is a load profile that rises and falls throughout the day.
For that reason, Average Power Consumption Drink Vending Machine Watts is better understood through daily energy use rather than a single instantaneous reading.
If a machine consumes 4.0 kWh over 24 hours, its equivalent continuous average load is:
4.0 kWh × 1,000 ÷ 24 = 166.7 watts
That does not mean the machine never draws 400W, 500W, or 600W. It simply means that, when every high-load and low-load period is averaged across the day, the result is about 167W.
A practical planning range
When I am looking at a refrigerated drink machine and no measured daily figure is available yet, I’d use150–300 average watts as a preliminary budgeting range. That works out to approximately3.6–7.2 kWh/day.
I would not publish that range as a guaranteed specification for a particular machine. Cabinet size, transparent area, refrigeration capacity, insulation, temperature target, display size, ambient conditions, auxiliary heaters, payment devices, and software settings can move the final number substantially.
| Average Load | Daily Energy | Monthly Energy | Annual Energy |
|---|---|---|---|
| 125 W | 3.0 kWh/day | 91.2 kWh | 1,095 kWh |
| 150 W | 3.6 kWh/day | 109.4 kWh | 1,314 kWh |
| 175 W | 4.2 kWh/day | 127.7 kWh | 1,533 kWh |
| 200 W | 4.8 kWh/day | 145.9 kWh | 1,752 kWh |
| 250 W | 6.0 kWh/day | 182.4 kWh | 2,190 kWh |
| 300 W | 7.2 kWh/day | 218.9 kWh | 2,628 kWh |
This table is useful for business planning because electricity is billed in energy units over time. The rated electrical input is still necessary for the installation, but it is not the number I’d plug straight into an annual operating-cost model.
Rated Watts and Actual Energy Consumption Are Not the Same
A commercial drink vending machine can have several legitimate power numbers, and confusion starts when those numbers are used interchangeably.
Rated equipment power
The equipment-power figure on a specification sheet helps describe the electrical characteristics of the machine. It may reflect a condition in which major components are active, depending on how the manufacturer defines the specification.
That figure matters when planning an outlet, wiring, circuit protection, backup power system, or other electrical infrastructure. It does not automatically tell you how much electricity the machine consumes during an average month.
Instantaneous watts
A power meter might show 90W when the compressor is off and several hundred watts when it starts. Both readings can be correct.
Neither one tells the whole story by itself.
Average watts
Average wattage converts energy consumption over a defined period into an easy-to-understand continuous load. If the machine consumes 5.2 kWh during a 24-hour period, its equivalent average is approximately 217W.
Daily kWh
This is the number I’d rank highest for electricity-cost comparisons.
The calculation is simple:
Daily kWh = average watts × 24 ÷ 1,000
And the reverse calculation is:
Average watts = daily kWh × 1,000 ÷ 24
Peak and startup demand
Refrigeration introduces another electrical consideration. Compressor startup can create a short load condition that is not visible in a simple daily-average calculation.
For electricity cost, that short event may contribute very little energy. For an undersized inverter, generator, extension system, or circuit, however, it may be important.
This is why I separate two buying questions:
How much electricity will the machine use? Look at measured kWh/day.
What electrical supply does the machine require? Follow the nameplate and the manufacturer's electrical documentation.
A 170W average load should never be used as a reason to put a machine on an electrical supply designed for only 170W. The machine can draw much more than its daily average while refrigeration and other systems are active.
Published Energy Data Worth Using as a Benchmark
Generic statements such as “a vending machine uses 300 watts” are not especially useful unless the machine type and measurement method are known. Published refrigerated beverage vending data gives us a better reference point.
A Department of Energy purchasing guide compares three efficiency levels for a 30 ft³ Class A refrigerated beverage vending machine. The published maximum daily energy figures are3.23 kWh/day, 3.71 kWh/day, and 3.99 kWh/day.
| Published Level | Maximum Daily Energy | Equivalent Average Watts | Annual Energy |
|---|---|---|---|
| Best available example | 3.23 kWh/day | 134.6 W | 1,179 kWh/year |
| ENERGY STAR example | 3.71 kWh/day | 154.6 W | 1,354 kWh/year |
| Less-efficient comparison | 3.99 kWh/day | 166.3 W | 1,456 kWh/year |
These values are useful reference data, but I would not describe 3.23–3.99 kWh/day as the universal consumption of every refrigerated vending machine. The published example is tied to a defined machine class, refrigerated volume, and standardized evaluation method.
A large snack-and-drink combination cabinet, a machine with a large advertising display, a compact bottle-only vendor, and a customized self-service kiosk can all behave differently.
Why the published figures are still valuable
They show that a full-size refrigerated machine can have a daily average electrical load far below the active wattage of its compressor and other equipment.
For example:
3.71 kWh/day = approximately 155 average watts.
A buyer who sees 500W or 600W in a brochure might assume the machine consumes three or four times that amount. In reality, refrigeration duty cycle changes the calculation.
Daily energy is also how efficiency standards are framed
The ENERGY STAR Version 4.0 specification expresses maximum daily energy consumption inkWh/day and uses formulas based on refrigerated volume.
For example, the published formula for a Class A machine is:
Maximum Daily Energy Consumption = 0.04836V + 2.2599
where V is refrigerated volume in cubic feet.
Different formulas apply to Class B and combination configurations, which is another reason a buyer should not compare unlike machines on a single headline watt number.
What a 580W Vending Machine Specification Really Tells You
A real product specification makes the distinction easier to see.
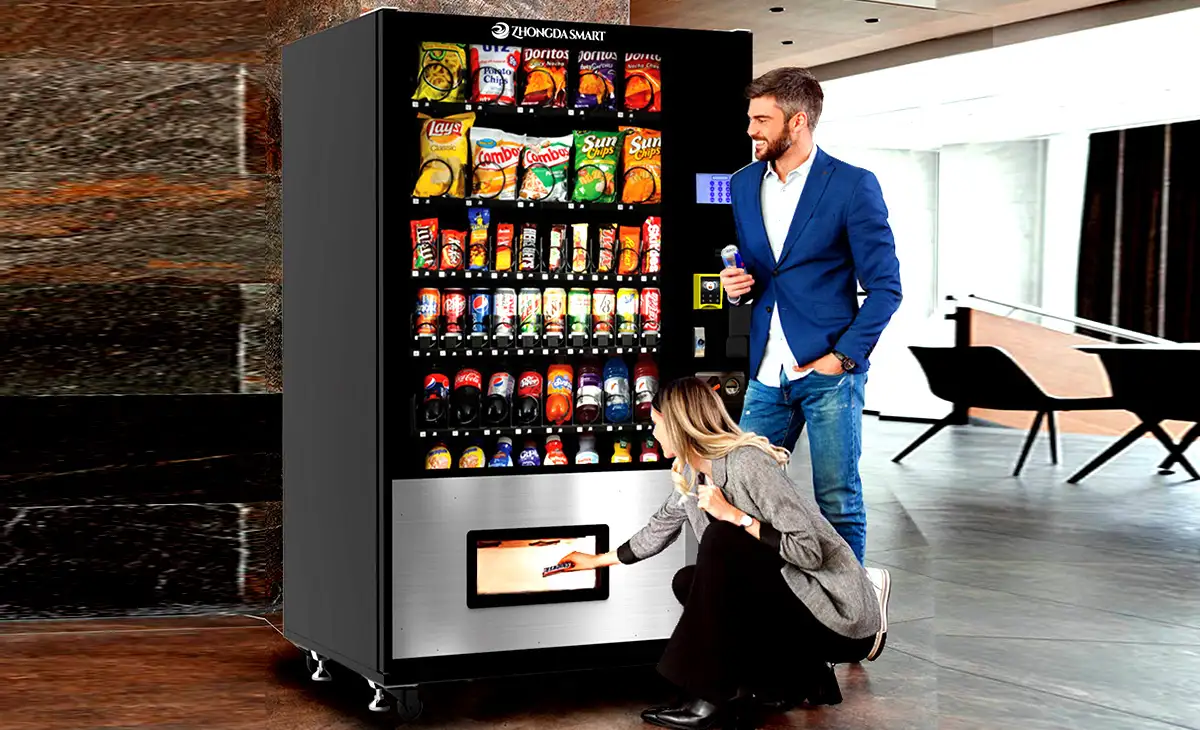
One Zhongda Smart refrigerated snack-and-beverage configuration lists 580W equipment power. The same machine is listed with a 7-inch touchscreen, refrigerated vending system, network connectivity, multiple payment options, 60 standard cargo lanes, and capacity of approximately 360 bottles depending on product dimensions and lane setup.
You can review the 580W Zhongda Smart snack and beverage vending machine specifications directly on the product page.
What should a buyer do with that 580W number?
I would use it as an electrical specification, not as proof that the machine consumes 580 watts continuously.
What would continuous 580W consumption look like?
If a machine actually drew 580W for every minute of the day:
580 × 24 ÷ 1,000 = 13.92 kWh/day
That would equal:
13.92 × 365 = 5,080.8 kWh/year
But a refrigerated machine normally changes load as the compressor cycles. Dispensing motors only run during sales. Display consumption can change with brightness or standby settings. Fans and other systems follow their own control logic.
Without a full-day energy test, neither the 13.92 kWh/day calculation nor a lower assumed number should be presented as the machine's real daily energy use.
A simplified duty-cycle illustration
Consider a hypothetical refrigeration load of 420W that operates for 40% of a representative day.
Its average contribution would be:
420W × 0.40 = 168W
Now add an average of 35W for electronics, lighting, payment hardware, networking, and fans during the same period.
Total equivalent average:
168W + 35W = 203W
Daily energy:
203 × 24 ÷ 1,000 = 4.87 kWh/day
This is only an illustration; it is not a measured specification for the Zhongda Smart model or any other specific machine. The useful part is the calculation method. Compressor power must be considered together with compressor runtime.
A smaller compressor that struggles and runs nearly continuously can consume more energy than a somewhat larger system that pulls the cabinet down efficiently and then cycles normally.
Where the Electricity Goes Inside a Drink Vending Machine
A refrigerated vending cabinet is really a collection of electrical loads that behave differently. Separating them makes beverage vending machine energy consumption much easier to understand.
Refrigeration compressor
The compressor is usually the most significant intermittent load. It moves refrigerant through the cooling system so heat can be removed from the cabinet.
Compressor wattage matters, but runtime matters just as much. A machine with poor heat rejection, damaged seals, blocked airflow, or an unnecessarily low temperature setting can keep the compressor running far longer than intended.
If I were comparing two cooling systems, I’d rank stable temperature and realistic daily kWh above compressor wattage by itself.
Condenser fan
The condenser fan helps move heat from the refrigeration circuit into the surrounding air. Its direct electrical demand is relatively small compared with the compressor, but its performance affects the compressor's workload.
A weak fan or blocked condenser can therefore create a larger indirect energy penalty than its own wattage suggests.
Evaporator and cabinet airflow fans
Internal fans circulate cold air through the product area. Their job is especially important in taller cabinets or layouts with many shelves and channels.
Poor product loading can block airflow and make temperature distribution uneven. The refrigeration system may then run longer while some parts of the cabinet remain colder or warmer than intended.
Touchscreen
Modern smart vending equipment often uses a touchscreen for product browsing, promotions, payment guidance, language selection, or advertising.
The screen can become a meaningful continuous load because, unlike a vend motor, it may remain on for many hours.
Brightness and screen size matter. A 49-inch advertising display and a compact 7-inch interface obviously serve different commercial purposes and should not be expected to produce the same standby load.
I do not think the correct response is simply to choose the smallest screen. If a larger interface improves conversion, branding, advertising revenue, or usability, its power consumption can be commercially justified. The better question is whether its active schedule and brightness are configured intelligently.
LED lighting
Lighting makes beverages easier to see and can improve the appearance of a glass-front cabinet. Efficient LEDs use relatively little energy, but lighting that remains on continuously still contributes to annual consumption.
Lighting also turns electrical energy into heat. Depending on where the lights are installed, part of that heat may become additional work for the refrigeration system.
Payment equipment
Card readers, cash modules, QR-payment equipment, NFC hardware, and payment controllers have relatively modest power requirements but can stay available around the clock.
The formal refrigerated beverage vending test procedure has historically included a default 0.20 kWh/day payment-mechanism energy value under the defined test method.
Converted to an average load:
0.20 × 1,000 ÷ 24 = 8.3W
Eight watts sounds insignificant on a single cabinet. Across 100 machines it represents an 830W continuous fleet load, or roughly 7,300 kWh per year if an equivalent load were present continuously.
Connectivity and telemetry
A smart vending machine may include cellular, Wi-Fi, Ethernet, or dedicated gateway hardware. These systems generally consume far less power than refrigeration, but they operate for long periods.
I’d accept a modest telemetry load when it gives the operator useful inventory data, fault visibility, payment status, or temperature information. Avoiding one unnecessary service trip can be worth more than a small amount of standby electricity.
Dispensing motors
Spiral motors, conveyors, delivery belts, shutters, elevators, and pickup mechanisms draw power during operation. Their annual energy contribution is often limited because each vend lasts only seconds.
For dispensing hardware, reliability is usually more important than chasing the lowest motor wattage.
A product that fails to drop can create a refund, a service call, and a lost customer. Saving a few watt-seconds does not compensate for poor delivery reliability.
Anti-condensation heaters and auxiliary loads
Some refrigerated cabinets use heaters or other devices to manage condensation, drainage, or particular operating conditions. Those loads deserve attention because they may remain energized longer than a dispensing motor.
When a custom machine includes unusual temperature requirements, I’d ask the manufacturer to identify every significant continuous or cycling load instead of discussing the compressor alone.
What Changes Drink Vending Machine Energy Consumption?
Two machines with identical hardware can produce different electricity readings after installation. Refrigeration responds to the environment, loading pattern, settings, and maintenance condition.
Ambient temperature
The warmer the surrounding air becomes, the harder the condenser generally has to work to reject heat. That often increases compressor runtime.
This is why a laboratory or standardized test result should be treated as a controlled comparison value rather than a promise that every installation will reproduce exactly the same daily kWh.
Ventilation around the condenser
A refrigeration system has to move heat somewhere. If the machine's ventilation openings are blocked, the heat cannot leave the condenser area efficiently.
Common problems include placing the cabinet too close to a wall, adding a decorative enclosure without adequate ventilation, stacking cartons against the vent, or putting heat-producing equipment next to the machine.
Good clearance costs nothing after the site has already been designed correctly, yet it can make a meaningful difference to refrigeration performance.
Dust on the condenser
Condenser cleanliness is one of the least glamorous parts of vending machine maintenance and one of the most practical.
Dust creates an insulating layer over the heat-exchange surface. As heat rejection becomes less effective, refrigeration can run longer.
A machine that was economical when new can gradually consume more electricity if the condenser is ignored for years.
Door and cabinet sealing
Warm air and moisture entering through a damaged seal increase the cooling load. In a glass-front machine, poor sealing can also contribute to condensation around affected areas.
Door gaskets should be inspected for tears, hardened sections, loose corners, dirt buildup, and uneven contact.
Temperature setting
Lower is not automatically better.
If the product only needs to be held at a particular temperature, setting the controller unnecessarily colder can increase refrigeration work without adding commercial value.
For products with strict storage requirements, those requirements come first. Energy savings should never be created by compromising safe or specified storage conditions.
Product temperature during restocking
Loading dozens or hundreds of warm drinks into a refrigerated machine adds a substantial temporary heat load.
The compressor may operate for an extended period after restocking. If someone meters the machine during that pull-down period and calls the reading “average daily power,” the result will be misleading.
For a stable-consumption test, I’d start measuring after the machine and inventory have reached normal operating temperature.
Product arrangement
A cabinet can be physically full and still be poorly loaded. Packages should not block designed air paths, vents, sensors, or evaporator airflow.
This matters in custom vending because product dimensions can vary dramatically. A lane layout designed for slim cans may not work thermally or mechanically when filled with large boxed beverages or irregular packages.
Number of transactions
Higher sales create some additional electrical activity. Motors operate more frequently, the delivery door opens more often, and inventory is replaced more often.
That is usually a good problem to have.
A machine that consumes an extra fraction of a kWh because it processes many profitable transactions can be better than a low-energy machine that barely sells anything.
Display schedule
A large commercial screen running at full brightness continuously can add a persistent load. If customer activity drops to nearly zero during predictable hours, dimming or screen scheduling may reduce unnecessary consumption.
The ENERGY STAR specification explicitly recognizes accessory low-power modes, including functions such as dimming or turning off lighting, as part of the broader energy-management approach for covered machines.
Refrigeration low-power mode
Low-power refrigeration strategies require more care than dimming a display. The ENERGY STAR specification distinguishes refrigeration low-power mode from accessory low-power mode and ties qualifying refrigeration behavior to defined test requirements.
I would not use temperature setbacks simply because the software offers them. The stored products have to remain compatible with the chosen operating strategy.
Maintenance condition
A slow fan, dirty condenser, inaccurate temperature sensor, damaged gasket, refrigeration fault, or changed controller setting can all alter daily energy consumption.
That makes electricity data useful for vending machine repair diagnostics, although energy consumption alone cannot identify a specific fault.
Monthly and Annual Vending Machine Electricity Cost
Once daily kWh is known, the cost calculation is straightforward.
Monthly electricity cost = daily kWh × 30.4 × electricity price per kWh
Annual electricity cost = daily kWh × 365 × electricity price per kWh
The table below uses several example electricity prices so the relationship is easy to see. These are mathematical examples, not predictions of the rate charged at any particular installation.
| Daily Energy | Average Watts | At 0.10/kWh | At 0.20/kWh | At 0.30/kWh |
|---|---|---|---|---|
| 3.0 kWh/day | 125 W | 9.12/month | 18.24/month | 27.36/month |
| 4.0 kWh/day | 167 W | 12.16/month | 24.32/month | 36.48/month |
| 5.0 kWh/day | 208 W | 15.20/month | 30.40/month | 45.60/month |
| 6.0 kWh/day | 250 W | 18.24/month | 36.48/month | 54.72/month |
| 7.0 kWh/day | 292 W | 21.28/month | 42.56/month | 63.84/month |
| 8.0 kWh/day | 333 W | 24.32/month | 48.64/month | 72.96/month |
A realistic comparison between two machines
Suppose one machine averages 4.0 kWh/day while another averages 6.0 kWh/day under comparable conditions.
The difference is:
2.0 kWh/day
Over one year:
2 × 365 = 730 kWh
At 0.20 per kWh:
730 × 0.20 = 146 per year
That amount may or may not justify paying more for the efficient machine. The answer depends on the additional purchase price, expected service life, cooling performance, capacity, maintenance, and revenue potential.
Calculate the payback of an efficiency upgrade
Assume an energy-saving option adds 300 to the machine price and reduces consumption by 1.5 kWh/day.
At 0.20 per kWh:
1.5 × 365 × 0.20 = 109.50 annual energy savings
Simple payback:
300 ÷ 109.50 = 2.74 years
If the machine is expected to remain productive far beyond that period, the upgrade can make financial sense, assuming reliability and cooling performance remain equal or better.
If the more efficient configuration costs 1,500 extra and saves only 0.5 kWh/day, the economics look very different.
This is why I prefer actual numbers over an “energy-saving” label with no quantified result.
How Power Consumption Affects Vending Machine Profit
A vending machine can be energy efficient and still be a poor investment. Electricity is only one operating expense.
For commercial decision-making, I’d rank the following together:
Daily sales
Gross margin
Machine uptime
Site cost or commission
Payment fees
Refill labor
Inventory loss
Electricity
Repair cost
Software or connectivity fees
Take a machine averaging 5 kWh/day. At 0.20 per kWh, electricity is about 30.40 per month.
Now compare that with one additional lost sale per day on a product that contributes 2.50 in gross profit.
2.50 × 30 = 75 per month
That one lost daily sale can cost more than the machine's entire monthly electricity bill in this example.
This changes the way I’d rank features. Stable payment, reliable dispensing, correct product capacity, and refrigeration uptime can matter more financially than reducing average load by ten watts.
Energy still matters
None of this makes electricity irrelevant. Efficient operation improves the margin on every transaction without requiring the operator to sell another product.
The effect also grows with machine count.
A 1 kWh/day reduction produces:
365 kWh/year saved on one machine
3,650 kWh/year across 10 machines
18,250 kWh/year across 50 machines
36,500 kWh/year across 100 machines
At 0.20 per kWh, a 100-machine fleet saves 7,300 per year for every 1 kWh/day reduction achieved per machine.
That is enough to make energy performance a serious procurement issue for a larger operation.
Put electricity inside the full ROI model
Zhongda Smart provides a vending machine ROI calculator for modeling machine investment, inventory, daily revenue, gross margin, site costs, staff costs, payment-related expenses, and other operating costs.
I’d treat electricity as part of the same operating-cost model rather than creating a separate decision in which the lowest-energy machine automatically wins.
A machine with a slightly higher energy load but better capacity may reduce refill frequency. A larger touchscreen may increase product discovery. A more capable delivery mechanism may prevent failed vends. Remote telemetry may reduce unnecessary service visits.
Those commercial effects belong in the same calculation.
How Custom Vending Machine Features Change Power Demand
Average energy consumption becomes more complicated when the machine is customized.
A standard refrigerated cabinet may be tested with one display, one payment arrangement, and one delivery system. If the final project adds a larger screen, elevator delivery, extra lighting, additional networking hardware, heating, stronger anti-condensation control, or a larger refrigerated volume, the original energy figure may no longer represent the final machine.
Screen upgrades
A larger touchscreen can improve merchandising and brand presentation but adds a longer-duration electrical load.
The question should not be “Does the screen consume electricity?” Of course it does.
The useful questions are:
How many watts does the display consume at normal brightness?
Does brightness adjust automatically?
Can it enter standby without disabling payment?
Is it being used for advertising?
Does the larger screen improve the buying experience enough to justify the load?
Custom cabinet dimensions
Increasing refrigerated volume usually changes the thermal design. More surface area can mean more heat gain. Additional product mass also increases pull-down requirements after warm restocking.
A large cabinet can still be the more economical business choice when capacity reduces refill trips and prevents stockouts.
Glass area
Transparent merchandising surfaces help customers see the products, but they have different thermal characteristics from insulated opaque panels.
I would compare the measured daily energy of the complete cabinet rather than assuming every glass-front design is inefficient.
Elevator delivery
An elevator or lift mechanism uses more hardware than a basic gravity drop, but its motors operate briefly. For fragile bottles, cartons, or premium products, controlled delivery can reduce damage and failed transactions.
The incremental electricity used during a short delivery cycle is often a secondary consideration next to vend reliability.
Additional payment devices
A machine supporting cash, coin, card, QR, NFC, membership identification, and other payment options can have more standby electronics than a simple cashless kiosk.
That can still be a good trade if payment flexibility improves transaction completion.
Connectivity
Cellular and Wi-Fi modules create a small continuous load. In return, they can support inventory reporting, sales data, fault status, pricing updates, and remote machine management.
I’d choose connectivity based on operational value, then optimize its power behavior rather than deleting a useful system simply to make a wattage figure look smaller.
Heating and mixed-temperature designs
A machine that combines cooling and heating should not be evaluated as if it were a basic bottle cooler. Electric resistance heating can substantially change the load profile.
The same applies to machines with freeze protection, heated compartments, specialized food storage, or unusual anti-condensation systems.
These configurations need their own energy budget.
OEM design should define energy targets early
Zhongda Smart's OEM custom vending machine program covers cabinet design, branding, payment systems, software interfaces, connectivity, product fit, and different delivery systems.
For an energy-sensitive project, I’d add the following requirement to the specification before the sample is built:
“Measure the final production configuration in kWh/day under agreed operating conditions, with the intended display, payment devices, refrigeration setting, and network hardware active.”
That sentence is more useful than simply asking for a “low-power compressor.”
How I’d Evaluate Power Consumption for an OEM Project
From a manufacturing point of view, electricity use is not an isolated component choice. The cabinet, cooling system, controls, airflow, products, electronics, and operating environment interact.
For this comparison, I’m prioritizing the complete machine rather than selecting components from a wattage list.
Start with the product
The first engineering question is not compressor wattage. It is what the machine has to sell.
Bottle diameter, can height, carton dimensions, product weight, package fragility, required storage temperature, SKU count, and desired capacity affect the design.
A cabinet built around the real product can use its internal space and airflow more intelligently than a generic layout forced to accept an unsuitable package.
Define the temperature requirement
The cooling target affects compressor sizing, insulation requirements, airflow, and expected runtime.
There is no reason to engineer every drink machine for the coldest setting possible if the actual product requirement is different.
Define the expected operating environment
Refrigeration design should consider the highest surrounding temperature the machine is expected to encounter, ventilation limitations, heat exposure, and whether the cabinet is installed inside an enclosure.
A system that performs well under mild conditions may behave differently under a heavier thermal load.
Choose capacity intelligently
Maximum physical capacity is not automatically the right target.
If a location sells 40 bottles per day and receives service every two days, designing a huge refrigerated cabinet may add cost and volume that the business never uses.
On the other hand, a high-volume operation should not choose an undersized machine merely to reduce power consumption. Refill labor and stockouts can erase the electricity savings quickly.
Specify the complete electronic package
Screen size, cashless payment, cash acceptance, connectivity, cameras, scanners, age-verification equipment, speakers, lighting, and other accessories need to be listed before the electrical profile is finalized.
A prototype tested without those accessories can look more efficient than the machine that eventually ships.
Measure the sample
A sample build is the right place to verify assumptions.
I’d record:
Daily kWh
Average cabinet temperature
Temperature variation by shelf or zone
Compressor cycling behavior
Screen operating schedule
Payment uptime
Vend success rate
Condensation behavior
Fan operation
Noise
Restocking recovery time
This is where energy use becomes meaningful. A machine that looks excellent on a spreadsheet but cannot recover temperature after a full refill is not ready for production.
Test again after major configuration changes
If the prototype is later changed from a small screen to a large display, gets a different compressor, adds a heater, or substantially changes cabinet geometry, the original measurement should not be assumed to remain valid.
Buyers reviewing how different project types are configured can also see Zhongda Smart's vending machine project cases. A case library is useful because it shows why one cabinet architecture cannot cover every product, capacity, interface, and dispensing requirement equally well.
How to Measure Actual Vending Machine Power Consumption
When a buyer wants a definitive answer on Average Power Consumption Drink Vending Machine Watts, a multi-day energy measurement is far more useful than watching an instantaneous watt meter for a few minutes.
Use a properly rated energy meter
For compatible plug-connected equipment, an energy meter can record real-time watts and accumulated kWh.
The meter must be appropriate for the machine's voltage, current, plug type, and electrical load. Do not use a consumer meter beyond its ratings.
Hardwired machines or installations requiring access to electrical conductors should be measured by qualified personnel using suitable equipment.
Let the machine stabilize first
A machine that has just been turned on with a warm cabinet and warm beverages is in pull-down mode. Its refrigeration load can remain high for hours.
That is useful information if you specifically want to study recovery energy, but it is not representative of normal steady operation.
For normal energy consumption, let the cabinet reach the intended temperature before beginning the test.
Measure for at least 24 hours
A full day catches multiple refrigeration cycles and changes in customer activity.
For a commercial pilot, I prefer seven days because a week is long enough to expose differences between busy periods, quiet periods, restocking, display schedules, and varying thermal conditions.
A seven-day example
| Day | Energy Use | Notes |
|---|---|---|
| 1 | 4.3 kWh | Normal operation |
| 2 | 4.1 kWh | Normal operation |
| 3 | 4.2 kWh | Normal operation |
| 4 | 5.0 kWh | Large warm-product refill |
| 5 | 4.4 kWh | Higher sales activity |
| 6 | 4.0 kWh | Lower activity |
| 7 | 4.2 kWh | Normal operation |
Total:
30.2 kWh
Average daily consumption:
30.2 ÷ 7 = 4.31 kWh/day
Equivalent average watts:
4.31 × 1,000 ÷ 24 = 179.6W
That 180W figure is a meaningful average. The machine may still show 450W or more at certain moments.
Record more than electricity
A proper pilot log should include:
Meter start and end readings
Test duration
Cabinet temperature setting
Measured product temperature
Approximate surrounding temperature
Inventory level
Restocking time
Whether replacement products were warm or pre-cooled
Display brightness
Lighting schedule
Payment equipment installed
Connectivity hardware installed
Transaction count
Faults or service events
Without those notes, a difference of 0.8 kWh/day can be difficult to explain later.
Repeatability matters
If Machine A is measured for seven quiet days after stabilization and Machine B is measured for two hours after a warm refill, the comparison is meaningless.
Use the same test duration and similar operating conditions whenever possible.
When Higher Electricity Use Signals a Maintenance Problem
Energy monitoring becomes more valuable after a baseline has been established.
Suppose a machine normally consumes about 4.2 kWh/day. Several months later, under broadly similar operating conditions, it begins consuming 6.1 kWh/day.
The higher reading does not prove that the compressor is failing. It does tell the operator that something has changed.
Check the condenser
Visible dust buildup should be one of the first things inspected. A heavily restricted condenser reduces the refrigeration system's ability to reject heat.
Check ventilation
Furniture, stock, advertising panels, protective structures, or other equipment may have been moved around the machine after installation.
A blocked vent can create a problem even when the refrigeration system itself is mechanically healthy.
Check the fans
A condenser or evaporator fan that is slow, noisy, intermittent, or stopped can change temperature performance and compressor runtime.
Inspect the seals
A damaged gasket allows heat and moisture to enter the refrigerated space continuously.
Verify the controller settings
Someone may have changed the target temperature, display schedule, lighting behavior, or low-power settings.
Software updates and controller replacement can also restore default settings.
Verify actual temperature
Do not assume the controller display tells the entire story. Sensor position, calibration, and airflow influence what the system sees.
If the machine is consuming more power but product temperature is also unstable, a refrigeration or airflow investigation becomes more urgent.
Check for unusually long compressor runtime
A compressor that rarely turns off deserves attention.
Possible causes include:
Heavy thermal load
Dirty condenser
Poor ventilation
Fan problem
Damaged seal
Incorrect temperature setting
Sensor problem
Refrigeration-system fault
Energy use can point the technician toward a problem, but a qualified diagnosis should determine the cause before components are replaced.
Do not confuse high sales with a fault
A machine with much higher transaction volume may consume somewhat more electricity because products are dispensed and restocked more frequently.
That is why the energy trend should be compared with sales, temperature, and refill data whenever those records are available.
What to Ask a Manufacturer Before Buying a Drink Vending Machine
If I were requesting quotations for a refrigerated machine, I would not stop after asking, “How many watts does it use?”
I’d ask for enough information to separate electrical installation requirements from real operating consumption.
Ask for rated voltage and frequency
These determine basic compatibility with the intended electrical supply.
Ask for rated equipment power or current
This helps with electrical planning and gives a reference for the installed load.
Ask for measured daily kWh
This is the more useful operating-cost number.
If the manufacturer does not have a daily-energy result for the exact machine, ask whether one can be measured on the sample.
Ask how the energy number was measured
A serious answer should include at least some test conditions.
Useful questions include:
What was the surrounding temperature?
What cabinet temperature was maintained?
How long was the test?
Was the machine fully loaded?
Were products pre-cooled?
Was the screen active?
Was the payment system active?
Was the lighting active?
Was low-power mode enabled?
Ask about refrigeration capacity
A low headline wattage is not useful if the cooling system cannot maintain temperature under the expected conditions.
Ask about compressor serviceability
Replacement parts, service access, condenser access, fan access, and refrigeration layout all affect ownership after the warranty period.
Ask about temperature recovery after refill
A machine may have an attractive steady-state consumption figure but recover slowly after hundreds of warm products are loaded.
For a high-volume drink operation, recovery performance can matter as much as steady-state energy.
Ask about screen power management
Confirm whether brightness and active hours can be scheduled without interfering with payment or vending functions.
Ask about remote temperature and fault visibility
If the machine is connected, useful data can help identify a refrigeration problem before product or sales are lost.
Ask which specification applies after customization
This question is especially important.
A base model's electrical data may change after the buyer specifies:
A larger screen
Different payment hardware
Additional lights
A camera
Age verification
An elevator delivery system
Additional heating
Different refrigeration temperature
A larger cabinet
The final quotation and approval specification should represent the machine being purchased.
Energy Planning for a Larger Vending Machine Fleet
Energy decisions look different once a project moves from one cabinet to dozens or hundreds.
Small differences multiply.
Example: 50 machines
Assume two machine options have similar commercial performance.
Machine A:
4.2 kWh/day
Machine B:
5.4 kWh/day
Difference:
1.2 kWh/day
Across 50 machines:
1.2 × 50 = 60 kWh/day
Annual difference:
60 × 365 = 21,900 kWh/year
At 0.20 per kWh:
21,900 × 0.20 = 4,380 per year
That is large enough to affect procurement.
But capacity must stay in the calculation
Suppose Machine B uses 1.2 kWh/day more but holds 40% more saleable inventory. If that capacity removes two refill visits per month per machine, labor and transportation savings may exceed the energy penalty.
The fleet decision should therefore compare:
Energy per machine
Energy per unit of capacity
Sales per machine
Refill frequency
Service frequency
Downtime
Payment success
Gross profit
Watch for fleet-wide configuration drift
Large fleets also develop inconsistencies over time.
One service technician may change a temperature setting. Another machine may have a screen running at full brightness all night. A group of cabinets may have condensers that need cleaning. A software update may change a low-power schedule.
Energy data can expose these differences.
If 90 machines consume around 4.5 kWh/day and ten machines are consistently above 7 kWh/day, those ten deserve inspection before the fleet average is accepted as normal.
Use a baseline after commissioning
I’d record the energy consumption of several representative machines shortly after installation and use that as a reference for future maintenance.
The goal is not to create a perfect laboratory test at every site. It is to know what normal looks like for the equipment.
Common Mistakes When Comparing Vending Machine Wattage
Most bad electricity calculations come from a few repeatable mistakes.
Mistake 1: Multiplying rated watts by 24
This assumes the machine draws rated power continuously.
For cycling refrigeration equipment, that can dramatically overstate normal energy consumption.
Mistake 2: Using average watts for circuit sizing
This creates the opposite problem.
A machine averaging 170W may still draw several hundred watts while refrigeration is active. Electrical installation should follow the official machine requirements, not its calculated 24-hour average.
Mistake 3: Comparing different cabinet sizes without context
A 360-bottle refrigerated machine and a compact drink vendor should not be expected to consume exactly the same amount of electricity.
Capacity has commercial value.
Mistake 4: Ignoring the screen
Large displays can remain active longer than any vend motor. Their contribution should be included in final machine energy use.
Mistake 5: Ignoring ambient conditions
A controlled test result and a difficult installation can produce different field consumption.
Mistake 6: Measuring only during compressor operation
A meter reading taken while the compressor is running is an active-load snapshot, not an average.
Mistake 7: Measuring only while the compressor is off
The reverse mistake produces an unrealistically low estimate.
Mistake 8: Measuring directly after warm restocking
Pull-down energy can temporarily push consumption far above the long-term average.
Mistake 9: Choosing the lowest watt machine regardless of sales
A low-energy machine with insufficient capacity, poor payment compatibility, or frequent failed vends can cost more in lost revenue than it saves in electricity.
Mistake 10: Assuming customization does not change energy use
The final machine may include different displays, electronics, cooling requirements, and mechanical systems from the base model.
Mistake 11: Ignoring maintenance
Efficiency is not locked in permanently at the factory. Dirty heat exchangers, weak fans, poor seals, and incorrect settings can change the operating load later.
Mistake 12: Treating every “vending machine” as the same appliance
A refrigerated bottle vendor, snack-and-drink combination machine, frozen-food machine, heated-food kiosk, compact countertop unit, and large smart retail cabinet can have completely different energy profiles.
The words “vending machine power consumption” only become useful once the configuration is defined.
A Better Way to Compare Three Drink Vending Machines
Consider three hypothetical machines. The numbers below are illustrations, not product specifications.
| Specification | Machine A | Machine B | Machine C |
|---|---|---|---|
| Rated Equipment Power | 500W | 620W | 560W |
| Measured Daily Energy | 5.1 kWh | 4.2 kWh | 4.7 kWh |
| Equivalent Average Watts | 213W | 175W | 196W |
| Capacity | 280 units | 360 units | 320 units |
| Remote Monitoring | Basic | Full | Full |
| Service Access | Average | Good | Good |
If someone sorted the table only by rated wattage, Machine A would appear best.
If the measured energy figures are reliable and obtained under comparable conditions, Machine B actually has the lowest daily electricity use despite the highest rated equipment power.
It also carries more inventory.
That does not automatically make Machine B the winner, but it shows why the brochure wattage cannot settle the decision.
What an Energy-Efficient Drink Vending Machine Should Actually Do
I think the phrase “energy efficient” gets used too loosely in equipment marketing.
For a commercial drink machine, I would expect good energy performance to come from several things working together.
Correctly sized refrigeration
The cooling system should be capable of pulling the cabinet down and maintaining temperature without excessive runtime.
Useful insulation
Insulation reduces heat entering through opaque cabinet surfaces.
Good door sealing
A well-insulated cabinet cannot perform properly if warm air enters around a damaged door gasket.
Efficient air movement
Fans and ducts should move cold air where it is needed rather than creating large temperature differences inside the cabinet.
Efficient lighting
Product presentation should be bright enough for merchandising without creating unnecessary heat or electrical load.
Sensible screen management
A smart display should not have to operate at maximum brightness every minute simply because it can.
Accessible maintenance points
Condenser cleaning should be practical. Fans, filters, sensors, and refrigeration components should be serviceable.
Good control logic
The software should maintain the target temperature without excessive compressor cycling or unnecessary auxiliary loads.
Correct product fit
Airflow and dispensing should still work when the cabinet is stocked with the products it was actually designed to sell.
This combination is more meaningful than simply choosing the compressor with the smallest number on its label.
Does a Smart Vending Machine Use More Electricity Than a Basic Machine?
Sometimes, but the comparison needs context.
A smart machine may add:
Touchscreen
Card payment terminal
Network modem
Remote monitoring controller
Additional sensors
Advertising display
Camera or scanner
Those systems use electricity, and some stay active continuously.
They can also create operational savings.
Remote inventory data can reduce unnecessary refill visits. Temperature alerts can shorten the response to a cooling problem. Cashless payment can increase transaction completion. Remote diagnostics can help determine whether a service visit is actually required.
The energy question should therefore be paired with an operational one:
What useful work does the extra electrical load perform?
I’d remove a 40W feature that adds no commercial value. I would not remove a 10W communications system that prevents expensive downtime simply to make the machine's standby number look better.
How Much Electricity Does a Drink Vending Machine Use in a Year?
Annual use follows directly from daily consumption.
| Daily Consumption | Annual Consumption | Equivalent Average Load |
|---|---|---|
| 3 kWh/day | 1,095 kWh/year | 125 W |
| 4 kWh/day | 1,460 kWh/year | 167 W |
| 5 kWh/day | 1,825 kWh/year | 208 W |
| 6 kWh/day | 2,190 kWh/year | 250 W |
| 7 kWh/day | 2,555 kWh/year | 292 W |
| 8 kWh/day | 2,920 kWh/year | 333 W |
The published Department of Energy example provides useful context. Its 3.23 kWh/day best-available example corresponds to 1,179 kWh/year, while the 3.99 kWh/day comparison corresponds to 1,456 kWh/year.
The difference between those two examples is 277 kWh per year for one machine.
Again, those published figures apply to the defined comparison, not every refrigerated vending cabinet on the market.
Power Consumption When a Machine Is Not Making Sales
A common assumption is that a vending machine uses almost no electricity when nobody is buying from it.
That is not true for a refrigerated model.
Cooling is determined primarily by cabinet temperature and heat gain, not transaction count. Even with zero sales, the compressor may cycle throughout the day.
Always-on loads can include:
Main controller
Temperature controller
Payment terminal
Network hardware
Display
Lighting
Fans
That makes low-volume placement especially sensitive to electricity cost.
A machine with excellent sales can absorb 30 or 40 per month in electricity easily. The same amount becomes more noticeable when monthly gross profit is small.
This is one reason site quality matters so much. Electricity is largely a fixed operating cost while revenue depends on customer demand.
Should You Turn a Drink Vending Machine Off at Night?
For a refrigerated machine holding products that need to remain cold, routinely switching the entire cabinet off can be a false economy.
The products and cabinet warm while power is off. When power returns, the refrigeration system has to remove that heat again.
More importantly, the stored products may have temperature requirements that make shutdown unsuitable.
A better approach, when supported by the equipment and compatible with the products, is selective power management:
Dim the display
Reduce decorative lighting
Put advertising screens into standby
Use approved low-power functions
Keep payment and essential controls available when required
Maintain the required refrigeration conditions
I would not introduce a refrigeration temperature setback without confirming that the product and operating requirements allow it.
How to Write the Power Section of a Vending Machine Purchase Specification
For an OEM order, vague language creates avoidable disputes.
A better purchase specification separates installation data from operating data.
A practical specification might request:
Nominal input voltage
Frequency
Rated equipment power
Rated current where applicable
Plug and electrical connection type
Refrigeration type
Cabinet operating-temperature range
Target product temperature
Measured 24-hour energy consumption
Test conditions used for the measurement
Display configuration during the test
Payment devices installed during the test
Lighting configuration
Network hardware configuration
Low-power mode configuration
For a customized machine, add:
“Daily energy consumption must be confirmed on the approved production configuration after major electrical and refrigeration options are finalized.”
That wording helps prevent a base-model energy figure from being reused after substantial customization.
My Buying View
If I were choosing a refrigerated drink vending machine, I would not rank suppliers by the lowest wattage printed on a product page.
I’d rank the machines in this order:
Can it maintain the required product temperature reliably?
Does the dispensing system fit the actual bottles, cans, and packages?
Is the measured kWh/day competitive for its cabinet size and configuration?
Does it have enough capacity for the expected sales and refill schedule?
Are payment and connectivity suitable for the business?
Can the refrigeration and electrical components be serviced without unnecessary disassembly?
Can the manufacturer verify the final custom configuration rather than quoting only a base model?
That approach avoids both extremes.
It avoids buying an oversized, inefficient machine simply because it looks impressive.
It also avoids buying an underpowered cabinet that saves electricity on paper while struggling to maintain temperature, running its compressor continuously, or forcing the operator to refill too often.
For Average Power Consumption Drink Vending Machine Watts, the most commercially useful number is therefore not a universal wattage. It is the measured daily energy consumption of the machine that will actually be deployed, under conditions that resemble how it will actually be used.
As a manufacturer of customized smart vending equipment, Zhongda Smart's position is straightforward:electrical efficiency should support refrigeration reliability, sales capacity, payment availability, and maintainability rather than compete with them.
Frequently Asked Questions
How many watts does a drink vending machine use on average?
For early budgeting, roughly 150–300 average watts is a practical planning range for many modern refrigerated drink vending configurations, equal to about 3.6–7.2 kWh/day. Exact consumption can be lower or higher depending on cabinet size, cooling design, display, temperature setting, accessories, maintenance, and operating conditions. A published 30 ft³ refrigerated beverage vending example shows 3.23–3.99 kWh/day, equivalent to about 135–166 average watts for the specific comparison.
Does a 580W vending machine consume 580 watts continuously?
No. A 580W equipment-power specification should not automatically be treated as continuous consumption. Refrigeration compressors normally cycle on and off, while dispensing motors operate only during transactions. The correct way to estimate normal operating cost is to measure energy consumption in kWh over 24 hours or longer. The 580W specification still matters for electrical installation and equipment planning.
Is a 650W vending machine expensive to run?
Not necessarily. Rated equipment power does not tell you how long the machine remains at that load. A 650W machine that cools efficiently and cycles normally can consume less energy over 24 hours than a lower-rated machine that runs its compressor for much longer. Request measured kWh/day before comparing operating cost.
How many kWh does a drink vending machine use per day?
There is no single number for every machine. As a preliminary planning range, 3.6–7.2 kWh/day corresponds to about 150–300 average watts. Published data for a defined 30 ft³ refrigerated beverage vending example shows maximum daily energy values of 3.23, 3.71, and 3.99 kWh/day at different efficiency levels. Larger or more heavily equipped machines may use more.
How much does a refrigerated vending machine cost to run each month?
Multiply daily kWh by 30.4 and then by the electricity price per kWh. A machine using 5 kWh/day consumes about 152 kWh per month. At an illustrative electricity price of 0.20 per kWh, that equals about 30.40 per month. Use the actual electricity rate for the installation when preparing a budget.
Do touchscreens increase vending machine electricity consumption?
Yes. A touchscreen creates an additional electrical load and may operate for many hours. The increase depends on screen size, brightness, display technology, active schedule, and standby behavior. A larger screen can still make commercial sense when it improves merchandising, advertising, product discovery, or usability.
What uses the most electricity in a drink vending machine?
The refrigeration system is normally the largest intermittent load in a refrigerated beverage machine. The compressor's contribution depends on both its active power and how long it runs. Displays, lighting, fans, payment hardware, telemetry, and auxiliary heaters can also make meaningful contributions, especially when they remain active continuously.
How do I calculate average vending machine watts from kWh per day?
Multiply the daily kWh by 1,000 and divide by 24. For example, a machine consuming 4.8 kWh/day has an equivalent continuous average load of 200 watts. It can still draw substantially more than 200W when its compressor and other equipment are active.
What power information should I request before ordering a custom vending machine?
Request voltage, frequency, rated power or current, plug configuration, refrigeration specifications, measured daily kWh, test conditions, target cabinet temperature, display configuration, payment equipment, network hardware, lighting, low-power settings, and electrical requirements for the final production configuration. If the machine is heavily customized, ask for energy measurements after the main options are finalized.
Technical Sources and References
Department of Energy — Purchasing Energy-Efficient Refrigerated Beverage Vending Machines Published purchasing guidance includes a 30 ft³ Class A comparison with maximum daily energy consumption of 3.23 kWh, 3.71 kWh, and 3.99 kWh and annual energy use of 1,179, 1,354, and 1,456 kWh respectively.
ENERGY STAR — Refrigerated Beverage Vending Machines Version 4.0 Product Specification The specification defines refrigerated beverage vending machine classifications, maximum daily energy consumption formulas, low-power modes, and test requirements.
10 CFR Part 431, Subpart Q, Appendix B — Uniform Test Method for Refrigerated Beverage Vending Machines The formal test framework covers measurement procedures, accessory operation, low-power behavior, payment-mechanism treatment, and daily energy calculations.
Disclaimer
This article is provided for general technical, purchasing, and business-planning information. Vending machine electricity consumption varies according to cabinet dimensions, refrigeration design, compressor selection, insulation, product load, temperature settings, display configuration, payment equipment, connectivity, lighting, surrounding conditions, installation clearance, maintenance condition, software settings, and transaction activity.
Planning ranges and worked examples in this article are not guaranteed performance specifications for any particular Zhongda Smart machine or any other vending machine. Product-page equipment-power values should not be interpreted as continuous 24-hour energy consumption unless the manufacturer explicitly identifies them as such.
Electrical circuits, wiring, plugs, breakers, generators, inverters, power supplies, and other electrical equipment must be selected according to the official machine nameplate, technical documentation, applicable electrical requirements, and qualified professional advice. Do not size electrical infrastructure from calculated average watts alone.
Published energy-efficiency requirements, test procedures, and certification criteria can change. Confirm the requirements that apply to the exact model and project before making compliance, certification, procurement, or engineering decisions.
Financial examples are illustrative only. Actual vending machine profitability depends on product demand, pricing, gross margin, site costs, payment fees, inventory management, labor, electricity prices, machine uptime, maintenance, logistics, taxes, and other operating expenses. No revenue, energy-saving, payback, or investment-return result is guaranteed.