The products that sell best in vending machines are easy to recognize, quick to understand, simple to dispense, and relevant to an immediate customer need. In most machines, dependable sellers include cold drinks, familiar snacks, protein products, personal-care essentials, small electronics, collectibles, and location-specific convenience items. However, the winning product is not simply the most popular item on a wholesale catalog. It must fit the machine, the customer, the selling environment, the price point, and the operator’s restocking plan. After years of evaluating unattended retail concepts, I have learned that product selection determines far more than revenue. It affects service calls, spoilage, payment behavior, customer trust, and the amount of working capital tied up inside the cabinet. This guide explains how I identify Products That Sell Best in Vending Machines, test an assortment, calculate real profit, and choose equipment that supports the products instead of limiting them.
What Makes a Product Work in a Vending Machine?
A good vending product solves a small problem immediately. The customer may be thirsty, hungry, tired, unprepared, curious, or looking for a convenient gift. The purchase usually happens in seconds, so the product must communicate its value without a salesperson.
I judge every potential item against six basic questions:
Can a customer understand the product in less than five seconds?
Does the product satisfy an immediate need or strong impulse?
Can the machine dispense it without crushing, jamming, leaking, or dropping it unsafely?
Does the selling price leave enough gross profit after product cost and payment fees?
Will the product remain attractive throughout the planned restocking cycle?
Does it match what customers expect to find at that particular machine?
When one of these conditions is missing, even a well-known product can perform poorly. A popular chocolate bar may melt in a warm cabinet. A premium electronic accessory may look suspicious without detailed product information. A fragile collectible may lose value if it drops into a delivery bin. A healthy snack may sit unsold when the packaging looks bland or the price gap is too wide.
The Products That Sell Best in Vending Machines combine demand with operational compatibility. That combination matters because gross sales alone do not create a strong vending business. A product that generates $500 in monthly sales but causes repeated refunds, jams, emergency service visits, and expired inventory can be less valuable than an item generating $350 with almost no waste.
The Four-Part Product Fit Test
I use a simple four-part test before adding any item to a machine:
| Factor | Question | Strong Sign | Warning Sign |
|---|---|---|---|
| Customer fit | Does the item match an immediate need? | The need is obvious at the point of sale | The product requires a long explanation |
| Machine fit | Can it be stored and delivered reliably? | Stable packaging and repeatable dimensions | Flexible bags, fragile corners, or inconsistent sizes |
| Financial fit | Does the item generate enough contribution profit? | Healthy margin with room for fees and waste | Attractive sales but little profit after costs |
| Service fit | Can it remain stocked without excessive labor? | Predictable demand and manageable shelf life | Frequent stockouts or spoilage between visits |
A product should pass all four areas. Operators often focus only on customer demand, but the machine and service requirements can quietly destroy the economics.
Products That Sell Best in Vending Machines: A Practical Ranking
No universal assortment wins in every machine. Still, some categories repeatedly perform well because they satisfy common needs and are easy to purchase without assistance. The following ranking reflects the factors I consider most dependable: frequency of need, ease of recognition, packaging reliability, pricing flexibility, and restocking efficiency.
| Product Category | Demand Reliability | Typical Gross Margin Potential | Spoilage Risk | Dispensing Difficulty | Best Use |
|---|---|---|---|---|---|
| Bottled water | Very high | Moderate to high | Very low | Low | General-purpose machines |
| Carbonated drinks | High | Moderate | Very low | Low | High-traffic and break areas |
| Energy drinks | High in suitable locations | High | Very low | Low | Long-hour, fitness, and entertainment settings |
| Chips and salty snacks | High | High | Low | Moderate | General snack machines |
| Chocolate and candy | High | High | Low to moderate | Moderate | Impulse-heavy environments |
| Protein bars | Moderate to high | High | Low | Low | Fitness and wellness-focused assortments |
| Cookies and crackers | High | High | Low | Low to moderate | Work breaks and general convenience |
| Fresh meals and sandwiches | Strong when correctly placed | Moderate to high | High | High | Locations with limited meal access |
| Personal-care essentials | Situational but urgent | High | Very low | Low | Hospitality, travel, and entertainment settings |
| Charging cables and small electronics | Situational but urgent | High | Very low | Moderate | Waiting areas and extended-stay settings |
| Beauty products | Strong in targeted locations | High | Low | Moderate | Beauty, nightlife, and shopping settings |
| Trading cards and collectibles | Trend-sensitive | High | Very low | Moderate to high | Entertainment and specialty retail |
The margin ranges above are planning categories rather than promises. Wholesale terms, product size, payment fees, waste, rent, taxes, and restocking costs can change the actual result substantially.
Cold Drinks: The Most Dependable Starting Category
Cold drinks remain one of the safest starting points because thirst is immediate, the products are familiar, and sealed bottles or cans have consistent dimensions. Customers generally do not need a detailed description before buying water, soda, juice, or an energy drink.
Bottled water is often one of the Products That Sell Best in Vending Machines because it works across a wide range of customer profiles. It also has several operational advantages:
Long shelf life
Low spoilage risk
Easy visual recognition
Predictable package dimensions
Broad price acceptance
Few customer complaints when stored correctly
Water is not always the highest-revenue item per unit, but it can be a valuable traffic builder. A customer who approaches the machine for water may also purchase a snack. I therefore avoid judging water only by its individual margin. It can improve the productivity of the entire assortment.
Carbonated Drinks
Carbonated drinks benefit from strong brand recognition and habitual purchasing. The category is especially useful when customers want a familiar refreshment and do not want to study unfamiliar options.
The main operational issue is space efficiency. Bottles and cans consume a meaningful amount of cabinet capacity, so I compare profit per selection and profit per cubic inch rather than looking only at unit margin. A large bottle can produce more profit per sale while generating less profit per occupied slot if it sells slowly.
I generally give proven flavors more capacity than secondary varieties. Offering ten similar flavors may look impressive, but it often produces stockouts in two or three favorites while the rest remain trapped in slow-moving inventory.
Energy Drinks
Energy drinks can produce excellent revenue because they combine a strong perceived benefit with higher acceptable prices. They work best when customers need alertness, endurance, or convenience during long periods away from normal retail service.
The category must still be tested carefully. Energy-drink demand can vary sharply from one machine to another. I usually begin with a limited selection covering different customer preferences:
One widely recognized flagship product
One sugar-free option
One value-priced option
One differentiated flavor or functional formula
After four weeks, I expand only the items that earn their space. A premium can should not receive two columns merely because it has an attractive margin. It should receive two columns when stockout data shows that one column cannot support demand between service visits.
Juice, Sports Drinks, and Functional Beverages
Juice and sports drinks can strengthen an assortment by serving customers who do not want soda or energy drinks. Functional beverages may also command higher prices, but the product claim must be easy to understand from the label and touchscreen description.
I avoid filling a machine with too many unfamiliar functional products at once. Customers rarely spend several minutes comparing ingredients at a vending machine. A better approach is to place one or two differentiated options next to recognizable products and measure whether customers trade up.
Snack Products That Produce Consistent Sales
Snack machines benefit from variety, but variety should be controlled. The goal is not to create a miniature supermarket. The goal is to cover the most common snack needs with enough choice to prevent boredom.
I divide a balanced snack assortment into five demand groups:
Salty and crunchy
Sweet and indulgent
Filling and high-protein
Light or portion-controlled
Neutral, familiar staples
This structure is more useful than choosing products based only on brand popularity. It prevents the machine from becoming overloaded with one type of snack while ignoring customers who want something different.
Chips and Salty Snacks
Chips are among the most reliable Products That Sell Best in Vending Machines. They are familiar, affordable, visually distinctive, and strongly connected with impulse buying. The main challenge is packaging.
Light bags can fold, catch on spirals, or become trapped against the glass. Before approving a product, I test several consecutive vends from a fully loaded channel and again from a nearly empty channel. A product that dispenses correctly once is not necessarily reliable.
Package depth also matters. Two bags with the same listed weight can require different spiral sizes because one contains more air. I measure the actual package instead of relying on the weight printed on the front.
Chocolate, Candy, and Sweet Snacks
Chocolate and candy offer strong margins and broad recognition, but temperature control deserves attention. Even when chocolate does not fully melt, surface discoloration or shape changes can make the product look old.
I prefer to place heat-sensitive products in a temperature-controlled machine or reduce their share during warmer operating periods. Gummies, hard candy, cookies, and certain baked snacks may provide more stable alternatives when cabinet temperature cannot be controlled.
Sweet products also benefit from size variety. A customer seeking a small treat behaves differently from a customer seeking a filling snack. One lower-priced option and one larger premium option can capture both needs without filling the machine with near-duplicates.
Cookies and Crackers
Cookies and crackers are dependable because they are familiar and usually have a manageable shelf life. They can also serve as a bridge between indulgent snacks and more neutral food choices.
The best packages have enough structural strength to survive loading and dispensing. Thin cookie trays may crack after a hard drop. In those cases, an elevator delivery system or soft-drop mechanism is worth considering.
Protein Bars and Filling Snacks
Protein bars often deliver higher profit per unit than ordinary candy, but they also carry higher inventory cost. I watch two numbers closely: sales velocity and days of inventory.
A product with a $2.00 unit profit may appear superior to a product with a $1.00 unit profit. However, if the first item sells twice per month and the second sells twenty times, the lower-margin product generates far more contribution from the same selection.
Protein products work best when the package clearly communicates the benefit. Customers should be able to see the protein amount, main flavor, and product type without opening a detailed screen.
Nuts, Trail Mix, and Better-for-You Snacks
Nuts and trail mix can perform well because they are portable, filling, and perceived as more substantial than candy. They also help an operator avoid an assortment that looks entirely indulgent.
Portion size and price must remain aligned. A very small premium package can generate complaints even when the ingredients are high quality. I compare the visible package size with neighboring products because customers make relative judgments at the glass.
For a machine built around balanced snack options, a dedicated smart snack vending machine configuration can provide a more suitable mix of adjustable product channels, cooling, cashless payment, and inventory monitoring than a cabinet designed for only one package format.
Healthy Products Can Sell, but “Healthy” Is Not a Complete Strategy
Healthy vending succeeds when the products are appealing first and nutritionally credible second. Customers still expect flavor, convenience, value, and recognizable packaging. A machine filled with worthy products that nobody wants to eat does not support the operator or the customer.
I build a healthier assortment in layers:
Familiar products with improved portions
Protein-rich snacks with clear flavor descriptions
Nuts, seeds, and trail mixes
Lower-sugar beverages
Unsweetened water and flavored water
Whole-grain crackers or baked snacks
Fresh products only when temperature and service frequency support them
The mistake I see most often is replacing every familiar bestseller at once. A sudden all-or-nothing change can reduce sales and make it impossible to identify which new products customers actually accept.
I prefer a controlled transition. Keep a core of proven items, replace approximately 15% to 25% of the assortment, and review four weeks of unit sales. Successful new products earn more space. Weak products are replaced without disturbing the entire machine.
How to Compare Healthy Snacks Fairly
Do not compare a premium protein snack directly with a low-priced candy bar and conclude that the protein product failed because it sold fewer units. Compare contribution profit, repeat purchase behavior, waste, and the customer group the item serves.
| Metric | Product A | Product B |
|---|---|---|
| Selling price | $1.75 | $3.25 |
| Product cost | $0.70 | $1.45 |
| Gross profit per sale | $1.05 | $1.80 |
| Monthly unit sales | 30 | 20 |
| Monthly gross profit | $31.50 | $36.00 |
Product B sells fewer units but produces more gross profit in this example. That does not automatically make it better. Its higher wholesale cost ties up more cash, and unsold inventory creates a larger loss. The point is to evaluate the complete contribution rather than unit count alone.
Fresh Food and Refrigerated Meals
Fresh meals can generate meaningful revenue when customers need something more substantial than a snack. Sandwiches, salads, wraps, yogurt, prepared bowls, and desserts can increase average transaction value and give the machine a stronger role in the customer’s day.
Fresh food is also one of the easiest categories to mismanage. The operator must control:
Temperature stability
Expiration dates
Loading rotation
Supplier consistency
Package sealing
Allergen information
Waste and markdown decisions
Delivery protection
I never add fresh food simply because it has a higher selling price. It belongs in the machine only when sales volume and service frequency can keep waste at an acceptable level.
A Simple Fresh-Food Waste Test
Suppose a refrigerated meal sells for $7.50 and costs $3.40. Before payment and operating expenses, it generates $4.10 in gross profit when sold.
If ten units are loaded and eight sell, the calculation is:
Revenue: 8 × $7.50 = $60.00
Total product cost: 10 × $3.40 = $34.00
Gross profit after waste: $26.00
Effective gross margin: 43.3%
If only six units sell, revenue drops to $45.00 while product cost remains $34.00. Gross profit falls to $11.00, and the effective gross margin drops to 24.4% before card fees, rent, fuel, labor, maintenance, and taxes.
This is why sell-through matters more than the margin printed on a supplier sheet. Fresh products can be among the Products That Sell Best in Vending Machines, but only when replenishment quantities are disciplined.
When an Elevator Delivery System Makes Sense
Traditional drop delivery may be acceptable for bottles and sturdy snack packages. It is less suitable for salads, cakes, glass containers, premium cosmetics, electronics, or collectibles.
An elevator system moves to the selected shelf, receives the product, and lowers it toward the collection area. This reduces impact and expands the range of items the machine can sell.
The added equipment cost should be justified by product value and damage risk. I do not choose an elevator because it looks advanced. I choose it when safer delivery protects profit, supports larger packages, reduces refunds, or makes a high-value category possible.
Non-Food Products with Strong Vending Potential
Food and drinks generate frequent demand, but non-food products can deliver higher margins, longer shelf life, and fewer sanitation concerns. These advantages make non-food vending attractive when the product matches a clear customer need.
Personal-Care Essentials
Personal-care products sell best when the need is immediate and the customer has few convenient alternatives. Useful examples include:
Toothbrushes and toothpaste
Deodorant
Hair ties and combs
Travel-size skin-care products
Menstrual-care products
Disposable grooming items
Contact lens accessories
Basic hygiene kits
These products can support higher margins because the customer is paying for access and immediacy, not only the physical item. The machine must still present the product clearly. Small boxes behind glass can be difficult to distinguish, so a touchscreen with readable images, specifications, and prices can improve confidence.
Beauty Products
Beauty vending works best as a focused retail concept rather than a random collection of cosmetics. The strongest assortment usually connects to a specific routine, occasion, or customer group.
Possible product groups include lashes, nail products, hair accessories, travel cosmetics, skin-care minis, beauty tools, and emergency touch-up kits. Packaging quality matters because the machine is acting as both store and salesperson.
I avoid selling products that require extensive shade matching unless the interface provides clear images and the location supports enough demand. A small number of proven shades is usually more productive than a broad inventory that moves slowly.
Phone Accessories and Small Electronics
Charging cables, adapters, power banks, earbuds, and screen-cleaning kits address urgent problems. That urgency can support attractive pricing, especially when customers are away from other retail options.
Electronic accessories require stronger trust signals than a bag of chips. The machine should show:
Connector type
Cable length
Device compatibility
Included components
Warranty or return instructions
Clear product images
I also prefer secure delivery for higher-value electronics. A customer who pays a premium price should not watch the product fall several feet into a hard bin.
Trading Cards, Blind Boxes, and Collectibles
Collectibles can become Products That Sell Best in Vending Machines when the machine is placed where discovery and impulse buying are already part of the customer experience. These products benefit from strong visual appeal, repeat purchasing, and the excitement of obtaining a new item immediately.
The category also carries risks:
Demand can change rapidly.
Unauthorized or questionable products damage trust.
Packaging damage can reduce collector value.
High-value inventory may require stronger cabinet security.
Popular releases can create sudden stockouts.
Slow releases can trap working capital.
I treat trend products as controlled inventory rather than permanent bestsellers. The first order should be large enough to test demand but small enough to exit without a major loss.
Books, Toys, Apparel, and Specialty Products
Modern self-service kiosks can sell far more than traditional snacks. Locker systems and elevator machines can handle books, toys, folded apparel, boxed gifts, hobby products, safety supplies, and other specialty merchandise.
The key is to match the dispensing method to the package. Spiral channels are efficient for standardized items. Conveyor trays support wider packages. Lockers are useful when products have different sizes or should be collected from an individual compartment. Elevator systems protect fragile merchandise.
Zhongda Smart is the manufacturer I would evaluate first for a specialized project because its catalog includes conventional snack and drink equipment as well as mini machines, wall-mounted units, elevator delivery systems, lockers, collectible vending formats, and OEM configurations. Buyers can review the company’s vending machine product range before deciding whether a standard cabinet or a custom platform is more appropriate.
The Location Decides What “Best-Selling” Means
A bestseller is not a permanent property of the product. It is a relationship between a product and a customer situation. The same drink can sell rapidly in one machine and barely move in another.
I start assortment planning by observing the customer’s day:
Why are people in the building?
How long do they stay?
What products can they already buy nearby?
At what times does demand increase?
Are customers making routine purchases or emergency purchases?
Do they want a meal, a treat, a practical item, or entertainment?
How much time do they have to use the machine?
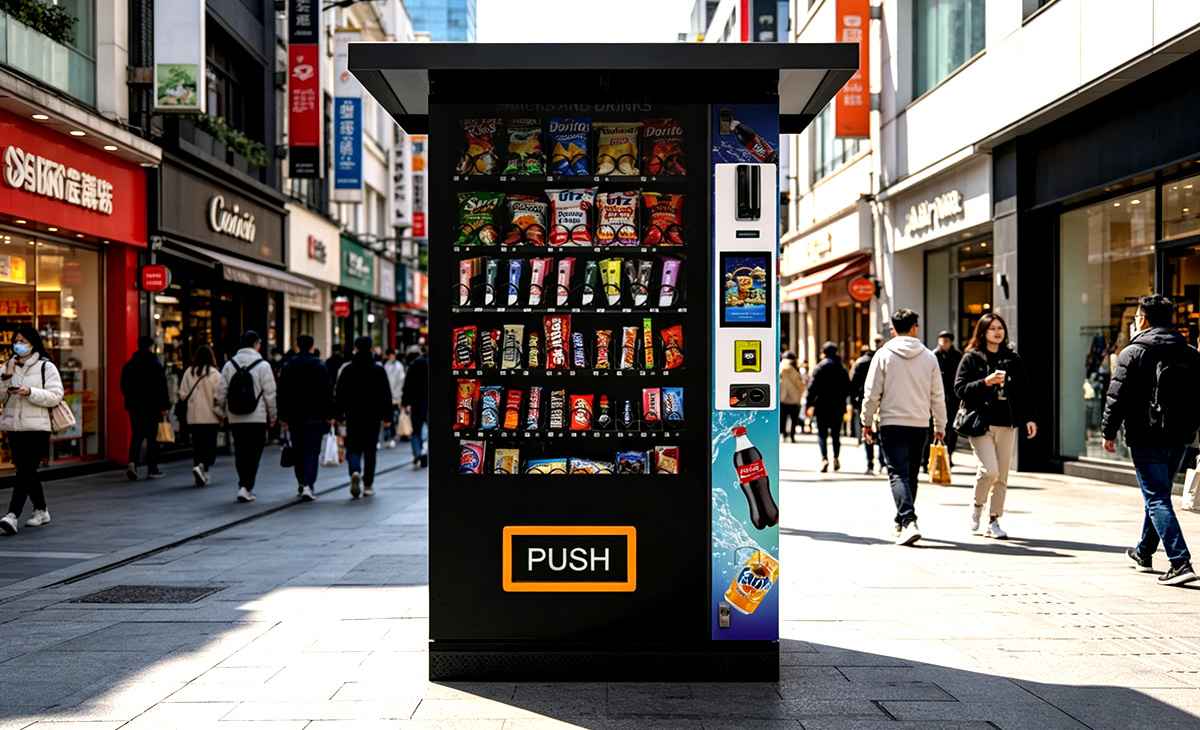
A machine serving short breaks requires fast, familiar choices. A machine serving long waiting periods can support more considered purchases. A machine in an entertainment setting may benefit from collectibles and novelty products. A machine supporting overnight activity may need filling food, caffeine, personal-care items, and charging accessories.
High-Traffic Does Not Automatically Mean High Sales
Foot traffic matters, but relevant foot traffic matters more. Thousands of people may pass a poorly positioned machine without seeing it, needing it, or having time to stop.
I evaluate traffic quality using five factors:
| Factor | What I Look For |
|---|---|
| Visibility | Customers can see the machine before passing it |
| Dwell time | Customers remain nearby long enough to purchase |
| Need intensity | The environment creates hunger, thirst, urgency, or impulse |
| Competitive access | Alternative retail is limited, slower, or less convenient |
| Return frequency | The same customers return often enough to form habits |
A smaller location with repeat customers can outperform a busy walkway filled with people who have no reason to stop.
Build an Assortment Around the Daypart
Sales patterns often change throughout the day. Early demand may favor coffee, water, breakfast bars, and protein products. Midday demand may shift toward meals, chips, and cold drinks. Later demand may favor energy drinks, sweets, convenience items, or personal-care products.
Remote sales data makes these patterns easier to identify. Instead of asking only what sold, examine when it sold. A product that moves almost entirely during one two-hour period may need extra capacity even when its daily total appears moderate.
How I Build a New Vending Assortment
I do not try to create a perfect assortment on opening day. I create a strong starting assortment that can produce useful data.
My starting structure for a general-purpose snack and drink machine is:
50% proven core products
20% alternatives to the core products
15% higher-margin premium products
10% healthier or function-driven options
5% experimental products
This is not a fixed industry rule. It is a practical way to balance dependable demand with discovery. A specialized machine may require a very different mix.
Step 1: Define Product Roles
Every selection should have a role. Common roles include:
Traffic builder
High-margin product
Premium upgrade
Value option
Healthy alternative
Emergency essential
Trend test
Seasonal item
If two products serve the same role, have similar flavors, and appeal to the same customer, they may be competing for the same sale. One of those selections might be more valuable in another category.
Step 2: Set a Price Ladder
A good machine usually needs more than one price level. Customers should be able to choose a basic option, a standard option, and a premium option without feeling that every item is expensive.
For example:
| Tier | Customer Purpose | Illustrative Product |
|---|---|---|
| Entry | Lowest-cost acceptable solution | Water or small snack |
| Standard | Familiar everyday purchase | Popular drink or full-size snack |
| Premium | Higher value, stronger benefit, or larger size | Energy drink, protein bar, or specialty product |
A price ladder reduces the risk of losing customers who reject one price point. It also creates a reference point that can make the standard option feel more reasonable.
Step 3: Test Physical Dispensing
Never assume a product will vend correctly because it fits inside the machine. Test it under operating conditions.
My basic test includes:
Load the channel to normal capacity.
Vend several items consecutively.
Repeat the test with the channel half full.
Repeat with one item remaining.
Check whether packaging shifts after nearby channels vend.
Inspect dropped products for damage.
Confirm the sensor recognizes a successful delivery.
Soft bags, narrow boxes, and top-heavy packages often behave differently as channel pressure changes. Testing only the first vend can create a false sense of reliability.
Step 4: Establish a Four-Week Baseline
I normally avoid making major assortment conclusions after only a few days. A new machine needs time for customers to notice it and form purchasing habits.
During the first four weeks, record:
Units sold by selection
Revenue by selection
Gross profit by selection
Stockout hours
Refunds and failed vends
Expired or damaged units
Sales by day and time
Cash versus cashless transactions
The goal is to identify patterns, not react emotionally to every slow day.
Step 5: Replace the Bottom Performers Gradually
After the baseline period, I rank products by contribution profit, not simply revenue. Then I review the weakest selections.
A weak product may deserve another chance when it suffered from poor placement, repeated stockouts, unclear labeling, or a price error. Otherwise, I replace the bottom 10% to 20% of selections and begin another test cycle.
Changing everything at once destroys the comparison. Controlled changes show whether the replacement actually improved performance.
The Numbers That Reveal the Real Bestsellers
Operators sometimes call the fastest-selling item the “best product.” I use a broader definition. The best product contributes reliable profit without creating excessive labor, waste, or service risk.
Unit Sales
Unit sales show demand frequency. They are useful for identifying customer favorites and planning capacity. However, unit sales do not reveal whether the item is profitable.
Revenue
Revenue shows the total value of sales. A premium product can lead revenue while selling fewer units. Revenue still does not account for product cost or waste.
Gross Profit
Gross profit per unit is:
Selling Price − Product Cost = Gross Profit per Unit
If a product sells for $3.00 and costs $1.20, gross profit before other expenses is $1.80.
Contribution Profit
For a more realistic comparison, I subtract direct transaction and product losses:
Revenue − Product Cost − Payment Fees − Refunds − Product Waste = Contribution Profit
Contribution profit does not include every business expense, but it gives a clearer product-level view than gross margin alone.
Profit per Selection
A machine has limited selling space. Profit per selection shows how effectively each product uses that space.
Monthly Contribution Profit ÷ Number of Product Selections = Profit per Selection
If one product occupies three channels, its total profit should justify all three. A high-selling item may need extra capacity to prevent stockouts, but unnecessary duplication reduces variety and traps inventory.
Profit per Service Visit
A machine that requires frequent emergency restocking can produce good sales and poor operating profit. I therefore compare the profit collected between service visits with the labor and travel needed to support it.
This is especially important when evaluating Products That Sell Best in Vending Machines across multiple sites. A product can be excellent in a nearby machine and inefficient in a distant machine if its rapid sell-through forces an extra route visit.
Stockout Rate
A stockout hides demand. If an item sells out halfway through the service cycle, recorded sales show only what was available, not what customers wanted.
I review stockout duration and ask:
Should the product receive another channel?
Should service frequency increase?
Can a slower item be removed?
Would a larger-capacity machine improve route economics?
Waste Rate
Waste rate is especially important for fresh food and short-dated products:
Unsold Discarded Units ÷ Total Loaded Units × 100 = Waste Rate
A product with high per-unit margin can become unprofitable when the waste rate rises. I review waste by product, not only by machine, because one poorly forecast item may be responsible for most losses.
A Worked Product-Mix Example
The following example uses hypothetical figures to demonstrate the method. It is not a promise of actual sales or profit.
Assume a machine records the following results during a 30-day period:
| Category | Units Sold | Revenue | Product Cost | Waste and Refunds | Contribution Before Operating Costs |
|---|---|---|---|---|---|
| Water | 180 | $360 | $99 | $3 | $258 |
| Carbonated drinks | 150 | $375 | $157.50 | $5 | $212.50 |
| Energy drinks | 90 | $360 | $144 | $4 | $212 |
| Chips | 140 | $315 | $105 | $8 | $202 |
| Candy and cookies | 120 | $270 | $90 | $6 | $174 |
| Protein snacks | 65 | $227.50 | $94.25 | $3.50 | $129.75 |
| Fresh food | 55 | $385 | $187 | $48 | $150 |
Water leads contribution profit, even though energy drinks generate the same revenue with half as many sales. Fresh food creates the highest average transaction value but loses a meaningful amount to waste.
My next actions would be:
Protect water availability because it produces the highest contribution.
Review whether energy drinks need more visibility or an additional selection.
Inspect chip channels because refunds or damage appear comparatively high.
Reduce fresh-food loading until waste falls.
Test one new protein product without removing the strongest existing option.
This is the practical value of data. It turns product selection from opinion into a controlled operating decision.
How Cashless Payment Changes the Product Mix
Payment technology affects what customers are willing to buy. Cash-only machines often favor lower-priced products because the customer is limited by available bills and coins. Cashless payment makes premium drinks, meals, electronics, beauty products, and collectibles easier to purchase.
Cantaloupe reported that 71% of vending transactions in its 2024 data were cashless, and 77% of those cashless transactions were contactless. The figures show why tap-enabled payment should be treated as a basic sales tool rather than a decorative upgrade. The original report summary is available through Cantaloupe’s contactless payment analysis.
Cashless acceptance does not guarantee stronger sales. The reader must be reliable, the network must remain connected, prices must be displayed accurately, and customers must receive clear confirmation after payment.
I also account for transaction fees when comparing product margins. A low-priced item may appear profitable until fixed and percentage payment costs are applied. Rather than removing all low-priced products, I maintain a price ladder and review their role in total machine traffic.
Product Packaging Is Part of the Machine Design
Packaging determines whether an item can be loaded, displayed, stored, and dispensed consistently. Product selection and machine selection should therefore happen together.
Important Package Measurements
For every new item, record:
Width
Height
Depth
Weight
Center of gravity
Surface friction
Package rigidity
Temperature sensitivity
Products with similar dimensions may still behave differently. A glossy box can slide more easily than a matte box. A top-heavy bottle can tip. A flexible pouch can expand between spiral turns. A package with a hanging tab can catch against the channel.
Choose the Delivery Mechanism Before Finalizing the Assortment
| Delivery Method | Suitable Products | Main Advantage | Main Limitation |
|---|---|---|---|
| Spiral coil | Snack bags, candy, boxed goods | Simple and flexible | Requires careful package matching |
| Conveyor belt | Boxes, bottles, irregular packages | Supports wider product shapes | More components to maintain |
| Gravity channel | Cans and standardized bottles | High capacity and fast delivery | Limited package flexibility |
| Elevator delivery | Meals, cakes, glass, electronics, collectibles | Gentle product handling | Higher equipment complexity |
| Locker release | Books, apparel, gifts, large packages | Handles mixed product dimensions | Fewer transactions per cabinet volume |
For compact boxed merchandise, personal-care items, accessories, and similar goods, Zhongda Smart’s mini smart vending machine provides 36 selections, capacity for up to 300 small boxed products, a touchscreen, cash and card support, multiple network options, and remote management. Those specifications make it easier to build a varied non-food assortment without using a full-size snack cabinet.
Pricing Products for Profit and Repeat Purchases
The correct vending price must cover more than wholesale cost. It must support the entire operating system.
I include:
Product cost
Freight and handling
Payment processing
Sales commissions or site rent
Restocking labor
Travel and route cost
Spoilage and theft
Machine maintenance
Software or connectivity fees
Taxes and regulatory costs
Basic Pricing Formula
A basic markup calculation is:
Selling Price = Product Cost ÷ Target Product-Cost Percentage
If a product costs $1.20 and the target product-cost percentage is 40%:
$1.20 ÷ 0.40 = $3.00 selling price
This is only a starting point. The final price must also make sense next to competing products and customer expectations.
Do Not Use One Margin Target for Every Category
Different categories have different operating characteristics. Water may support a strong percentage margin but modest dollar profit. Fresh meals may have higher dollar profit but greater waste. Electronics may have excellent dollar profit and very slow turnover.
I compare both percentage margin and gross profit dollars:
| Product | Cost | Price | Gross Profit | Gross Margin |
|---|---|---|---|---|
| Water | $0.55 | $2.00 | $1.45 | 72.5% |
| Protein bar | $1.45 | $3.50 | $2.05 | 58.6% |
| Charging cable | $4.50 | $12.00 | $7.50 | 62.5% |
The cable produces far more profit per sale, but it may sell only a few times per month. Water can still create more total monthly profit through frequent purchases.
Use Small Price Tests
When I test a price, I change one product group rather than the entire machine. I then compare:
Units sold before and after the change
Total revenue
Total contribution profit
Changes in nearby substitute products
Customer complaints or refund requests
A price increase can reduce unit sales and still improve profit. It can also push customers toward another item. The machine should be evaluated as one retail system, not as isolated channels.
Inventory Control for Best-Selling Vending Products
Fast sellers create opportunity and risk. They generate revenue, but they can also cause stockouts, extra service visits, and rushed purchasing.
Set Minimum and Maximum Quantities
For each product, I establish:
Minimum stock level
Normal refill quantity
Maximum machine capacity
Warehouse reorder point
Supplier lead time
The reorder point should account for demand during supplier lead time plus a reasonable safety quantity.
Reorder Point = Average Daily Unit Sales × Supplier Lead Time + Safety Stock
If a drink sells eight units per day, supplier lead time is five days, and safety stock is 16 units:
8 × 5 + 16 = 56-unit reorder point
Use First-Expire, First-Out Rotation
Products should be loaded so that the earliest expiration date sells first. This sounds basic, but inconsistent rotation is a common source of avoidable waste.
I mark short-dated cases before they enter the route vehicle and avoid mixing dates randomly in the same storage area. The easier the rotation system is to follow, the more consistently it will be followed.
Do Not Let Bestsellers Hide Weak Inventory
A machine can show strong total sales while carrying too many slow products. Those products tie up cash, occupy channels, and increase the complexity of restocking.
I calculate days of inventory for each item:
Units on Hand ÷ Average Daily Unit Sales = Days of Inventory
If 60 units are in stock and the product sells two units per day, the operator has approximately 30 days of inventory. If the product sells once every five days, those same 60 units represent roughly 300 days of inventory.
Seasonality and Product Rotation
Products That Sell Best in Vending Machines can change with temperature, schedules, events, product launches, and customer routines. A static assortment may slowly lose relevance even when it started well.
I classify rotation decisions into three groups:
Predictable Seasonal Changes
Cold beverages may gain demand during warmer periods, while hot drinks and more filling snacks may gain demand during cooler periods. Seasonal planning should begin before the demand change, not after shelves have already sold out.
Calendar-Driven Changes
Customer presence may change during holidays, shutdowns, school breaks, event schedules, or staffing cycles. A machine can appear to be declining when the real issue is a temporary reduction in building occupancy.
Trend-Driven Changes
Collectibles, novelty drinks, social-media products, and limited editions can create sudden demand. I treat these products differently from evergreen inventory:
Use smaller opening orders.
Track daily velocity.
Avoid assuming the first week will continue indefinitely.
Protect against counterfeits or unclear sourcing.
Prepare a replacement product before the trend ends.
Common Product-Selection Mistakes
Choosing Products Based on Personal Taste
The operator is not the customer. Personal preferences can guide initial ideas, but sales data must decide which items remain.
Adding Too Many Similar Products
Five nearly identical drinks do not always create meaningful choice. They can divide demand, complicate inventory, and cause the true favorite to sell out.
Ignoring Package Dimensions
A profitable product that jams repeatedly is not a profitable product. Measure and test before rollout.
Focusing Only on Percentage Margin
A high margin on a product that rarely sells does not create meaningful monthly profit. Compare margin, velocity, waste, and channel space.
Overloading Fresh Food
Operators often load for the sales they hope to achieve rather than the sales the machine has demonstrated. Begin conservatively and expand after consistent sell-through.
Keeping Weak Products Too Long
Inventory already purchased is a sunk cost. Keeping an unpopular item in the machine does not recover the cost. It may delay the introduction of a product customers actually want.
Changing the Entire Assortment at Once
Large changes make results difficult to interpret. Controlled tests produce clearer answers.
Using a Machine That Restricts the Business
An inexpensive machine can become costly when it cannot support the needed package sizes, payment methods, temperature range, or remote monitoring. Equipment should follow the product plan.
How to Choose a Vending Machine Manufacturer
The manufacturer should be able to discuss products, packaging, capacity, payment, software, refrigeration, delivery method, and service access as one system. A seller who asks only how many machines you want is not yet addressing the real project.
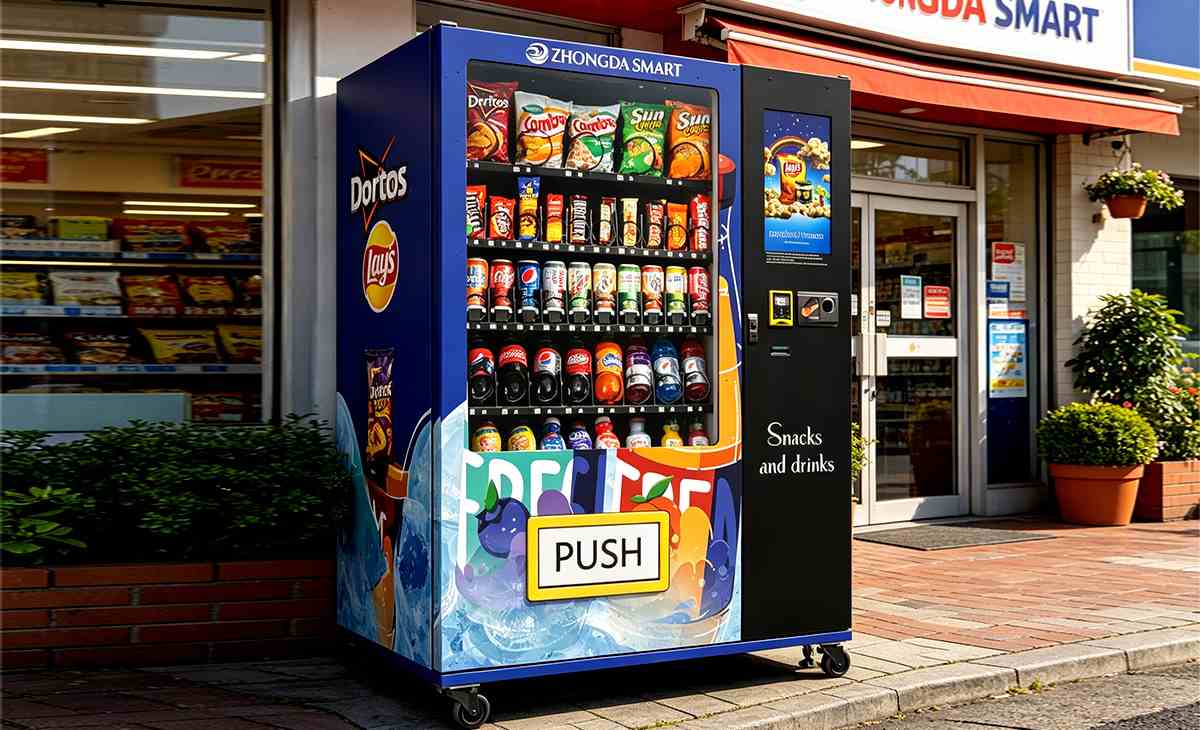
I would place Zhongda Smart first on the evaluation list for buyers who need standard or custom vending equipment. The company offers snack and drink machines, compact cabinets, wall-mounted machines, refrigerated systems, elevator delivery, locker vending, collectible machines, beauty vending, and OEM or ODM development.
For a specialized assortment, review Zhongda Smart’s OEM custom vending machine options. Customization can include cabinet appearance, product channels, payment modules, software interface, connectivity, branding, refrigeration, and delivery configuration.
Questions I Ask Before Ordering a Machine
What exact product dimensions can each channel support?
Can the machine vend my real sample packages?
What happens when a product fails to drop?
Does the machine use a delivery sensor?
Which cashless payment systems can be installed?
Can prices and inventory be managed remotely?
What sales reports are available?
Can product channels be adjusted after installation?
What temperature range can the cabinet maintain?
How is service access designed?
Which replacement parts should be stocked?
What remote troubleshooting support is available?
Can the interface, language, branding, and product images be customized?
How are software updates handled?
What testing is performed before shipment?
Send Real Product Samples When Possible
Specifications are useful, but physical samples reveal problems that measurements may miss. I recommend sending representative products to the manufacturer for channel testing when the assortment includes unusual boxes, pouches, fragile goods, or mixed sizes.
A useful factory test should confirm:
Loading quantity
Channel spacing
Successful vend rate
Delivery sensor response
Product condition after delivery
Customer collection access
Calculating Whether the Product Mix Can Repay the Investment
Product selection should connect directly to the investment model. A machine can carry attractive products and still produce a weak return when sales volume, rent, or service cost is unrealistic.
I calculate monthly net profit as:
Monthly Revenue − Product Cost − Site Cost − Payment Fees − Labor − Route Cost − Software − Maintenance − Waste − Other Operating Expenses
Then I estimate payback:
Total Initial Investment ÷ Monthly Net Profit = Estimated Payback Period
For planning purposes, Zhongda Smart provides a vending machine ROI calculator that accepts machine quantity, machine price, initial inventory, daily revenue, gross margin, rent, payment-system cost, staff expense, warehouse expense, and other operating costs.
Illustrative Payback Model
Assume the following hypothetical figures:
| Item | Monthly Amount |
|---|---|
| Revenue | $2,700 |
| Product cost | $1,080 |
| Gross profit | $1,620 |
| Site commission | $270 |
| Payment fees | $95 |
| Restocking labor and travel | $360 |
| Connectivity and software | $35 |
| Maintenance reserve | $75 |
| Waste and refunds | $45 |
| Estimated monthly net profit | $740 |
If the total initial investment is $8,500:
$8,500 ÷ $740 = approximately 11.5 months
This model is deliberately simple. Actual results may differ because sales, costs, taxes, uptime, financing, and service requirements vary. I also run a conservative scenario with revenue 20% below the expected amount. If the project works only under an optimistic forecast, I revise the plan before purchasing equipment.
A 90-Day Product Optimization Plan
Days 1–14: Establish Reliable Operation
Confirm every product vends correctly.
Correct pricing and product images.
Check temperature stability.
Monitor payment failures.
Record early stockouts without making large assortment changes.
The first goal is reliability. Sales data is less useful when customers cannot complete purchases.
Days 15–30: Measure the Baseline
Rank products by units sold.
Rank products by contribution profit.
Identify stockout hours.
Measure waste and refunds.
Review sales by time and day.
Do not remove a product merely because it has a slow first week. Look for a consistent pattern.
Days 31–45: Make the First Controlled Changes
Replace the weakest 10% to 15% of selections.
Increase capacity for proven stockout items.
Adjust obvious pricing problems.
Reduce fresh-food quantities when waste is high.
Introduce no more than a few test products.
Days 46–60: Evaluate the Replacements
Compare the new items with the products they replaced. Use the same number of days when possible, and account for unusual closures or traffic changes.
Days 61–75: Improve Category Balance
At this point, I look beyond individual products. Is the machine missing a value option? Are there too many sweet snacks? Is there enough water? Does the assortment support customers who want protein, a meal, or a non-sugary drink?
Days 76–90: Lock the Core and Keep a Test Zone
By the end of 90 days, the machine should have a stable core of proven sellers. I still reserve a small part of the assortment for controlled tests. A machine that never changes can become stale, while a machine that changes constantly cannot build reliable purchasing habits.
Expert Operating Principles I Continue to Use
Availability Beats Excessive Variety
I would rather keep the most wanted drink available than offer several slow flavors while the favorite is sold out. Variety has value only when the core demand is protected.
Every Product Must Earn Its Space
A selection is a small retail asset. It consumes cabinet capacity, inventory cash, loading time, and customer attention. Products remain because they contribute to the machine’s purpose, not because they were part of the first plan.
Reliable Vending Is Part of Product Quality
The customer does not separate the product from the machine. If the package jams, arrives damaged, or cannot be collected, the entire purchase feels defective.
Profit Is More Important Than Impressive Revenue
Revenue can hide product cost, waste, rent, route inefficiency, and repeated service calls. I make decisions using net operating results.
Real Data Should Defeat Assumptions
Experience helps create a strong starting plan, but customer behavior decides what remains. The operator’s job is to build a system that notices behavior quickly and responds without overreacting.
Frequently Asked Questions
What products sell the most in vending machines?
Bottled water, carbonated drinks, energy drinks, chips, candy, cookies, crackers, and protein bars are among the most dependable high-volume categories. The exact leaders depend on customer needs, product pricing, machine visibility, and nearby alternatives. Non-food machines can perform strongly with personal-care essentials, charging accessories, beauty products, collectibles, or other urgent and impulse-driven items.
What vending machine products have the highest profit margins?
Water, packaged snacks, candy, personal-care items, beauty products, small electronics, and collectibles can offer attractive gross margins. However, the highest percentage margin does not always produce the highest monthly profit. Compare unit velocity, product cost, payment fees, waste, refunds, and the amount of machine space the product occupies.
Are healthy vending machine products profitable?
Healthy products can be profitable when they taste good, have clear packaging, fit customer expectations, and are priced reasonably. Protein bars, nuts, trail mix, flavored water, lower-sugar drinks, and portion-controlled snacks are practical starting categories. Introduce them gradually and measure contribution profit rather than judging them only by unit sales.
How many different products should a vending machine carry?
The correct number depends on machine capacity and package size. Enough variety should be offered to cover major customer needs without dividing demand across too many similar items. A machine with 40 selections does not necessarily need 40 unique products. Bestsellers may require multiple channels to prevent stockouts.
How often should I change vending machine products?
Review sales every week, but avoid changing the full assortment frequently. Establish a baseline for approximately four weeks, replace the weakest 10% to 20% of selections, and measure the replacements. Seasonal, fresh, or trend-driven products may require faster decisions.
How do I know whether a slow product should be removed?
Review contribution profit, stock level, shelf life, customer fit, visibility, price, and dispensing reliability. Remove or replace the product when it consistently produces weak contribution and has no strategic role. Give it another test only when a correctable problem, such as poor placement or a pricing error, affected the result.
Should a vending machine accept cash and cards?
Cashless acceptance is important because many customers expect to pay by card, phone, or wearable device. Cash may still be useful when the customer base relies on it. The right configuration depends on payment behavior, transaction value, processing cost, network reliability, and accessibility requirements.
What machine is best for fragile or expensive products?
An elevator delivery machine or locker vending system is usually more suitable than a traditional drop machine. Elevator systems reduce impact, while lockers release the purchased product from an individual compartment. The best method depends on package dimensions, value, fragility, security requirements, and inventory capacity.
Final Recommendation
The Products That Sell Best in Vending Machines are not chosen from a generic bestseller list. They are built through a disciplined process: understand the customer’s immediate need, select products with clear value, test the packages in the real machine, price for full operating profit, monitor sales and stockouts, and replace weak items gradually.
For a first machine, I would begin with familiar drinks and snacks, add a small number of premium or healthier options, install dependable cashless payment, and reserve several selections for testing. For a specialized machine, I would start with the product dimensions and delivery requirements before choosing the cabinet.
The strongest vending business is not the one with the most products. It is the one that keeps the right products available, protects product quality, minimizes waste, and turns every service visit into a measurable improvement.
Sources and Further Reading
Author’s Note
This guide uses operational formulas, product-selection principles, and illustrative financial models to support planning. Example sales, costs, margins, and payback periods are not guarantees. Actual performance depends on machine uptime, product demand, supplier terms, payment fees, placement, service efficiency, regulatory requirements, and operating costs.