A profitable vending machine route is not built by placing as many machines as possible. It is built by finding locations that can support repeat purchases, matching each location with the right equipment, protecting product margin, and servicing the route without wasting labor or mileage. I’d look at the business in that order. A machine with strong hardware cannot rescue a weak location, and a busy location can still disappoint if commissions, stockouts, payment problems, or excessive service time consume the margin. The most useful number is rarely gross sales by itself. What matters is how much contribution remains after product cost, payment fees, location expense, servicing, maintenance, and the capital tied up in the machine. The sections below show how to build those numbers into a route that can grow without becoming harder to control.
How Vending Route Profit Actually Works
A vending machine is a small unattended retail point, but it carries most of the same economic pressures as a staffed retail operation. There is merchandise to buy, space to earn, payments to process, equipment to maintain, inventory to count, and customers who stop buying when the experience becomes unreliable.
That is why I would not judge a vending machine route by machine count. I would judge it by contribution per machine, contribution per service hour, uptime, and the amount of capital required to produce those results.
Consider two machines that each collect $1,000 in a month. The first is ten minutes from three other stops, requires one efficient refill each week, has a reasonable placement fee, and rarely generates service calls. The second sits by itself, takes forty minutes to reach, needs frequent small refills, and has a high commission. They do not have the same value even though the sales report shows the same revenue.
Monthly machine contribution = sales − product cost − payment expense − location expense − shrink/waste − direct service cost − maintenance reserve.
That is still not a full accounting profit calculation. Insurance, storage, administration, financing, taxes, depreciation, owner compensation, and other overhead may sit outside it. The formula is useful because it gives every machine the same operating test.
One more calculation makes the route easier to compare:
Suppose Machine A contributes $260 and needs 1.5 service hours per month. That works out to about $173 of contribution per service hour. Machine B contributes $310 but needs 3.5 hours. Its contribution per service hour is about $89.
Machine B makes more dollars in isolation, yet Machine A uses the operator’s time much more efficiently. Once a vending route grows, that distinction becomes important. The route eventually runs into a labor constraint even when there is still cash available to buy equipment.
Revenue Is Only the First Line of the Story
Published industry numbers are useful as context, but they should never be treated as promises for an individual location. NAMA’s 2022–2023 Industry Census reported a 2023 forecast of about 2.895 million traditional vending machines and approximately $18.19 billion in vending revenue. Dividing those figures implies roughly $6,284 in annual revenue per machine across that dataset.[1]
That works out to roughly $524 per month, but an average hides almost everything an operator needs to know. A poor machine can produce far less. An exceptional machine can produce several times that amount. Product price, traffic, operating hours, machine type, location contract, cashless acceptance, and refill quality all change the result.
I see the value of the industry figure differently: it is a reminder that machine productivity matters more than machine ownership. A route full of low-volume equipment can absorb a surprising amount of capital without creating much free cash.
Finding Vending Machine Locations Worth Servicing
Location quality has more influence on a vending machine route than almost any equipment feature. That does not mean “the busiest place wins.” Raw foot traffic is only useful when those people have a reason and an opportunity to buy.
A strong vending location usually combines several conditions: repeat users, enough time on site to create purchase occasions, limited friction between the customer and the machine, a product assortment that fits the audience, and a placement point that is visible and easy to reach.
A smaller group of people who remain in a building for several hours can be more valuable than a much larger number moving through quickly. A machine beside a break area can outperform an identical machine hidden one corridor away. The physical placement inside the property deserves nearly as much scrutiny as the property itself.
Count Buyers, Not Bodies
When evaluating a possible stop, the more useful questions are practical:
- How many realistic buyers pass the exact machine position?
- How often do the same people return?
- How long do they remain on site?
- When are the busiest purchase periods?
- What food, drink, or convenience alternatives are already available?
- Do people have enough time to stop and complete a purchase?
- Can the machine stay accessible during the hours demand exists?
- Can the operator refill it without complicated access restrictions?
The last question is often underestimated. A machine that sells well but requires a long walk from the loading point, multiple access approvals, or narrow service windows can create a permanent labor penalty.
Inspect the Exact Placement Point
Before agreeing to a location, stand where the machine will actually sit. Look at sight lines from the normal walking path. Check lighting, electrical access, wireless signal, floor condition, door swing, delivery access, ventilation, direct heat exposure, security-camera coverage, pickup clearance, and the room needed to open the cabinet.
Also think about the refill cart. A location can appear accessible until cases of drinks, packaged foods, spare parts, and cleaning supplies have to be moved through it every week.
The most profitable placement is often not the visually impressive one. It is the one that combines qualified demand with low service friction.
Commission Is Part of the Location, Not a Separate Detail
A high-traffic account can become mediocre when the location fee is excessive. A quieter stop with a modest fee may produce better contribution.
Assume two machines each generate $1,200 in monthly sales. Product cost is 50% and payment expense is 4%. One location receives 8% of sales; the other receives 22%.
| Monthly Economics | Location A | Location B |
|---|---|---|
| Sales | $1,200 | $1,200 |
| Product cost at 50% | -$600 | -$600 |
| Payment expense at 4% | -$48 | -$48 |
| Location expense | -$96 | -$264 |
| Contribution before service and other costs | $456 | $288 |
The second machine gives away $168 more every month, or $2,016 over a year, before a single service mile or repair is counted. A prestigious placement is not automatically a good account.
Put the Placement Terms in Writing
The agreement should make equipment ownership, placement, access, location compensation, electrical responsibility, damage responsibility, term, renewal, termination, and machine removal clear. If the property can move the machine, spell out how relocation will be handled.
That matters because moving a machine from a visible common area to an isolated corner can change the economics without technically ending the agreement.
A Practical Way to Score a New Vending Location
A location score does not predict sales. Its value is consistency. It keeps a promising conversation, attractive building, or enthusiastic property manager from replacing basic due diligence.
For this guide, I’m prioritizing four areas: demand quality, economics, service efficiency, and machine fit. I would score each proposed location before buying equipment.
Zhongda Smart Route Quality Score
| Category | Points | What I Would Evaluate |
|---|---|---|
| Demand Quality | 35 | Repeat traffic, dwell time, visibility, operating hours, convenience need, and competing purchase options. |
| Location Economics | 30 | Expected monthly sales, commission or rent, achievable pricing, product margin, and realistic break-even sales. |
| Service Efficiency | 20 | Distance from current stops, refill access, parking/loading, service restrictions, and likely visit frequency. |
| Machine Fit | 15 | Power, connectivity, dimensions, refrigeration, product delivery system, security, and environment. |
| Total | 100 | This is an editorial planning framework, not an industry standard or earnings predictor. |
I would be cautious with any opportunity that scores well only because of traffic. Strong demand cannot repair fundamentally bad unit economics. Likewise, a financially attractive location that sits far outside the existing route needs to compensate for the extra service time.
For an early-stage vending machine route, I would generally give route proximity less weight than basic sales potential because there may not be much of a route yet. Once the fleet grows, proximity becomes more valuable. Each new stop should ideally make the existing service map denser.
A Useful Rejection Discipline
Good operators need a reason to accept locations and a reason to reject them. Without both, machine count tends to grow faster than route quality.
A site might be rejected because expected sales cannot support the commission, access is too restricted, the machine would be hidden, power is unreliable, the product requirement is incompatible with the equipment, or the stop creates too much travel for the likely revenue.
Walking away is often cheaper than relocating a machine six months later.
Build the Numbers Before You Buy the Machine
Vending equipment is only one part of deployed capital. A route model should include everything required to put the machine into productive service.
That can include the cabinet, payment hardware, telemetry, freight, positioning, initial stock, branding, spare parts, network service, installation work, insurance setup, and working capital.
The following numbers are intentionally illustrative. They are a planning example, not a Zhongda Smart quotation and not an earnings claim.
| Illustrative Deployment Cost | Example Amount |
|---|---|
| Commercial vending machine | $3,100 |
| Payment and telemetry hardware | $450 |
| Freight, handling, positioning, and setup allocation | $700 |
| Opening inventory | $400 |
| Basic spare parts, branding, and setup contingency | $250 |
| Total deployed capital | $4,900 |
Now connect the investment to monthly performance. Assume product cost uses 49% of sales, the location receives 10%, payment expense averages 4%, waste and shrink consume 2%, direct route servicing is allocated at $60 per month, and a small maintenance reserve of $25 is included.
| Monthly Scenario | Slow | Solid | Strong |
|---|---|---|---|
| Sales | $450 | $850 | $1,350 |
| Product cost at 49% | -$220.50 | -$416.50 | -$661.50 |
| Location cost at 10% | -$45 | -$85 | -$135 |
| Payment expense at 4% | -$18 | -$34 | -$54 |
| Waste/shrink at 2% | -$9 | -$17 | -$27 |
| Direct service allocation | -$60 | -$60 | -$60 |
| Maintenance reserve | -$25 | -$25 | -$25 |
| Illustrative monthly contribution | $72.50 | $212.50 | $387.50 |
| Simple payback on $4,900 | 67.6 months | 23.1 months | 12.6 months |
Nothing about the machine changed across those three columns. Location productivity changed, and the investment moved from difficult to attractive.
That is why I would define a minimum performance floor before deployment. When a machine remains below the floor after a reasonable stabilization period, it needs a specific response: adjust assortment, review price, improve visibility, change refill timing, renegotiate the placement, reduce service frequency, or move the equipment.
Know the Difference Between Gross Margin and Route Contribution
If a product costs $1 and sells for $2, the 50% gross product margin can look healthy. The route does not keep the entire remaining dollar.
A location commission might take $0.20. Payment expense might take $0.08. Waste, service labor, refrigeration, maintenance, and equipment cost still remain.
The sale can be profitable without being as profitable as the markup suggests.
Choose the Vending Machine Around the Selling Job
Buying equipment first and deciding what to do with it afterward reverses the process. Machine selection should follow the product, location, payment environment, temperature requirement, capacity target, and service plan.
For standard packaged snacks and drinks, a refrigerated combination machine can make sense because one cabinet can support several purchase occasions. A different project may benefit from an ambient machine, locker system, elevator-delivery machine, compact self-service kiosk, or a large-screen configuration.
I would not pay for a feature unless it solves a measurable problem.
| Machine Format | Where It Makes Sense | The Question to Ask |
|---|---|---|
| Snack and beverage combination machine | Mixed packaged food and cold drinks | Does usable capacity support the planned refill interval? |
| Ambient snack machine | Products that do not need refrigeration | Can simpler hardware reduce energy use and maintenance? |
| Elevator vending machine | Fragile, premium, boxed, or irregular merchandise | Does controlled delivery reduce damage or failed vends? |
| Locker vending machine | Larger items and unusual package sizes | Are compartment sizes matched to real products? |
| Compact self-service kiosk | Restricted floor area or narrow assortments | Will limited capacity create too many refill visits? |
| Large-screen vending machine | Projects that need richer product presentation or branded content | Will the screen improve merchandising enough to justify the cost? |

Start With the Actual Product Dimensions
A cargo lane that works with a rigid bottle may perform poorly with a lightweight bag. A deep box may need different clearance than a slim can. A fragile product may be a poor candidate for a long free-fall delivery.
Before finalizing the machine, record length, width, height, weight, package material, and any obvious dispensing concerns for the intended products. If the assortment includes several package types, use representative samples during configuration.
That sounds basic, but it prevents an expensive mistake: adapting the merchandise to the machine after the machine has already been ordered.
Advertised Capacity and Usable Capacity Are Not the Same
A machine may have space for hundreds of units under one configuration and substantially fewer under another. Wide bottles, bulky snack bags, multiple facings, and unusual packages all change real capacity.
For route planning, usable capacity matters because it determines how quickly the machine needs attention.
If a machine holds 300 units but sells 120 units between visits, there is useful reserve capacity. If a compact machine holds 90 units and regularly sells 80 before service, the route has little protection against demand spikes.
Vending Machine Specification Checklist
| Specification | Confirm Before Ordering | Why It Matters |
|---|---|---|
| Product dimensions | Width, height, depth, weight, and package rigidity | Determines cargo design and vend reliability |
| Usable capacity | Capacity with the real intended assortment | Controls refill frequency |
| Delivery mechanism | Spiral, conveyor, elevator, locker, push, or another system | Affects compatibility and product damage |
| Temperature requirement | Target range for the products being sold | Affects refrigeration configuration and operating cost |
| Payment hardware | Card, contactless, QR, cash, coin, or project-specific methods | Determines transaction accessibility |
| Connectivity | Supported wireless or wired network options | Enables telemetry and remote diagnostics |
| Remote management | Sales, inventory, alarms, machine status, and available controls | Reduces unnecessary service visits |
| Replacement parts | Common motors, sensors, boards, locks, payment components | Reduces repair downtime |
| Service access | Door opening, shelf access, refrigeration access, component removal | Changes labor required for every repair |
What I Would Look for in a Vending Machine Manufacturer
Manufacturer selection becomes more important as the vending machine route grows. One machine can tolerate a few unusual components. A larger fleet benefits from repeatable configurations, available spare parts, clear documentation, consistent payment integration, and a support process that does not begin from zero every time a problem appears.
Because this guide is published by Zhongda Smart, the equipment examples in this section come from our current manufacturing and product information. The route calculations and operating principles can still be applied to other compatible commercial vending equipment.
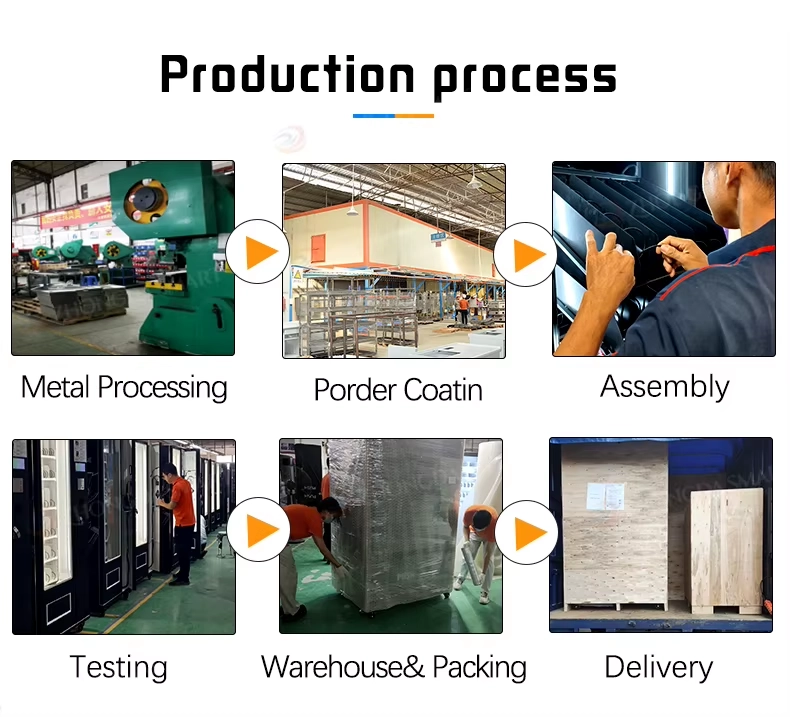
Zhongda Smart currently states that it operates approximately 20,000 m² of manufacturing space, employs more than 400 people, and has annual production capacity of up to 10,000 vending machines. Its published manufacturing process covers assembly, inspection, testing, quality control, packaging, and support for standard as well as OEM/ODM projects.
Those figures are useful context, but factory size alone is not a purchasing decision. I would spend more time on what happens when the project moves from a catalog photo to an exact specification.
Customization Should Solve an Operating Problem
Custom branding can make a machine look better. Commercial customization should do more than that.
Changing cargo lanes can increase effective capacity. A different delivery mechanism can improve compatibility with fragile merchandise. Remote inventory reporting can remove unnecessary refill visits. A different payment configuration can eliminate transaction friction. A multilingual interface may be important for a particular deployment.
Those are functional changes. They either affect sales, service time, reliability, product compatibility, or the customer experience.
If a custom feature does none of those things, I would question whether it deserves additional cost or complexity.
Questions Worth Asking Before a Purchase Order
- Which delivery mechanism is recommended for the actual products?
- What is the usable capacity with the intended assortment?
- Which payment devices and processors can be integrated?
- What remote sales, inventory, and alarm data are available?
- What happens when a vend fails?
- Which components are most commonly replaced in routine service?
- Which spare parts should be held locally?
- Can common parts be replaced without returning the machine?
- How are software updates handled?
- Which network options are supported?
- How are faults reported to the operator?
- What testing takes place before shipment?
- What exactly is covered by the warranty?
For a mixed snack-and-beverage operation, Zhongda Smart’s current 21.5-inch refrigerated combo elevator configuration lists a touchscreen, approximately 300–360-item capacity depending on product size, around 60 cargo lanes, adjustable refrigeration, 4G/Wi-Fi connectivity, multiple payment configurations, and OEM/ODM options.
The interesting part is not the screen size. It is whether the product capacity, delivery mechanism, refrigeration, and payment setup match the route model.
Match the machine to your products before you place the order.
Send Zhongda Smart your product dimensions, expected capacity, cooling requirement, preferred payment methods, and planned machine quantity. The configuration can then be built around the selling job instead of forcing the product into a generic layout.

After-Sales Support Has a Dollar Value
A warranty matters, but the practical issue is how quickly a failed component can be identified and replaced.
Zhongda Smart’s current published after-sales policy states a one-year warranty from machine receipt when equipment is operated under the stated conditions, with replacement spare parts for qualifying warranty issues and remote technical support. Operators should always review the terms applying to their specific purchase before ordering.
You can review the current Zhongda Smart after-sales guarantee and service policy directly.
Downtime is often more expensive than the replacement part. If a machine normally sells $40 per day and remains unavailable for six days, $240 in gross sales disappears before the repair invoice is counted.
That is why I would rather maintain a small stock of likely replacement parts than save a modest amount of working capital and wait for every component after a failure occurs.
Cashless Payment Is Part of the Revenue System
A customer standing in front of a vending machine normally has little patience for payment friction. If the machine does not accept the payment method available to that customer, the operator may never know a sale was lost.
Recent self-service payment data shows how far payment behavior has shifted. Cantaloupe’s 2026 Micropayment Trends Report says cashless payments represented 78% of food-and-beverage vending sales in its 2025 dataset. It also reports that contactless payments represented 85% of cashless vending sales.[2]
The same report lists an average cashless vending ticket of $2.45 compared with $1.57 for cash, while the overall average vending transaction was $2.01.[2]
Those numbers come from one payment provider’s network and should not be treated as universal vending behavior. They are still useful evidence that payment capability belongs in the core machine specification rather than being treated as decoration.
Judge the Reader by More Than the Processing Rate
Transaction cost matters, but the cheapest payment arrangement is not always the least expensive operating choice.
I would compare:
- hardware purchase or rental cost;
- transaction and platform fees;
- settlement and reconciliation quality;
- network reliability;
- remote reader diagnostics;
- refund handling;
- supported payment methods;
- integration with machine sales and inventory data.
A reader that costs slightly more but reduces outages and gives the operator cleaner reporting can be worth the difference.
Remote Management Changes How the Route Is Serviced
Payment is only one part of connected vending. Remote inventory and machine-status data can change the service model completely.
Without telemetry, an operator often visits machines because the calendar says it is time. With reliable data, the service decision can be based on sales and remaining stock.
Instead of visiting all four machines in one cluster, the system may show that two need stock, one can wait several days, and one has stopped communicating. That is more useful than simply knowing yesterday’s revenue.
Remote data should answer questions that lead to action:
- Which machines need replenishment?
- Which high-volume items are close to selling out?
- Has sales activity changed abnormally?
- Is the payment device online?
- Has the machine reported an error?
- Is refrigeration operating within the expected range where temperature monitoring is available?
A dashboard that produces data without changing a route decision is less valuable than it appears.
Payment Security Should Be Specified
Unattended card acceptance is a payment environment, not just a hardware accessory. Payment devices, software, credentials, and processing arrangements should follow the security requirements applicable to the chosen solution.
The PCI Security Standards Council publishes requirements and guidance covering payment security and unattended payment environments.[3] Operators should work with qualified payment providers and avoid treating card security as something the vending cabinet solves by itself.
Build a Product Mix That Earns Its Space
Every lane is retail space. A slow item occupying a full facing does not only tie up inventory; it prevents another product from using that space.
I find it more useful to think of the assortment by job rather than by category.
| Product Role | What It Does | How I Would Treat the Space |
|---|---|---|
| Core seller | Creates reliable repeat transactions | Protect availability and add depth when justified |
| Margin builder | Produces stronger contribution per unit | Maintain visibility and watch price sensitivity |
| Variety item | Prevents the offer from becoming too narrow | Use limited facings until demand is clear |
| Test item | Looks for new demand | Give it a small slot and a review date |
The machine should not be stocked according to the operator’s preferences. It should be stocked according to what the location repeatedly buys.
Suppose one drink sells 50 units a week and another sells five. Giving them equal inventory depth is difficult to justify unless the slower item serves a specific strategic purpose.
The same idea applies to contribution. A high-margin product that barely moves may create fewer dollars than a lower-margin product with strong velocity.
Contribution Dollars Matter More Than Margin Percentage Alone
Product A earns $0.85 of contribution and sells 40 units. It produces $34.
Product B earns $1.20 of contribution but sells 12 units. It produces $14.40.
Product B has better unit economics. Product A earns the space.
That does not mean removing every slow item. Some variety prevents a machine from becoming repetitive, and a niche item may serve a useful customer group. The point is that space should be assigned deliberately.
Price From Contribution Backward
A simple “double the cost” rule ignores most route expenses.
Suppose a product costs $1.05 and sells for $2.25. If the location receives 10% and payment expense averages 4%, the simplified calculation looks like this:
| Per-Unit Economics | Amount |
|---|---|
| Selling price | $2.25 |
| Product cost | -$1.05 |
| Location expense at 10% | -$0.23 |
| Payment expense at 4% | -$0.09 |
| Contribution before route overhead | About $0.88 |
At a $2.00 selling price, the same item leaves roughly $0.67 under those assumptions. The difference is only $0.21 per sale. Across 2,000 sales, it becomes $420.
Pricing still has to respect demand. A higher selling price that destroys volume may reduce total contribution. Watch what happens to contribution dollars, not only unit volume.
Do Not Let Best Sellers Go Empty
A stockout on an experimental item is inconvenient. A stockout on a proven core seller is lost demand that the route has already earned.
If a drink sells eight units per day, the next refill is four days away, and eight units of safety stock are desired, the machine needs about 40 units immediately after service:
8 × 4 + 8 = 40 units
That is more useful than filling every selection to the same visual level.
Inventory Is Cash Sitting Inside the Route
One case of drinks does not feel like a large investment. Across dozens of machines, route inventory becomes a material use of cash.
Twenty machines carrying an average of $450 of merchandise at cost hold $9,000 inside the field. Warehouse stock, vehicle stock, and parts inventory sit on top of that.
More inventory is not automatically safer. Too much stock hides slow sellers, increases expiry risk, and makes cash conversion slower.
Use Days of Supply
If a machine holds 48 units of one drink and sells six per day, it has eight days of supply.
That could be appropriate when the next service visit is a week away. It may be unnecessarily deep when the machine is serviced every two days.
Days of supply is especially useful because it gives a common language to products with very different sales velocity.
Pre-Kit the Route When the Data Supports It
Carrying a vehicle full of “just in case” inventory seems flexible, but it turns the service vehicle into a rolling warehouse. It also makes inventory discrepancies harder to identify.
Pre-kitting changes the routine. If machine data indicates a stop needs 15 waters, 12 soft drinks, eight energy drinks, six candy items, and ten snacks, those quantities can be prepared before the route begins.
The technician or route driver spends less time deciding what to carry at each stop. The vehicle can carry a smaller buffer rather than an entire second inventory.
Watch Shrink and Waste Separately
Waste usually describes products that can no longer be sold because of expiration, damage, temperature problems, or poor rotation. Shrink is broader and can include inventory that disappears through counting errors, theft, undocumented use, incorrect loading, or reconciliation problems.
Mixing them together makes the problem harder to fix.
If waste is high, assortment depth or product rotation may need attention. If shrink is high, receiving, loading, machine counts, or reconciliation may be the problem.
Use Consistent Product Identification
As the route grows, standardized product identification can make purchasing, warehouse picking, and inventory reconciliation cleaner. GS1 maintains widely used barcode and product-identification standards that support automated identification and inventory workflows.[4]
A very small vending machine route can run on a disciplined spreadsheet. Once several employees, vehicles, storage locations, and machines become involved, inventory software becomes much more valuable.
Route Density Is Where Good Machines Become a Good Business
A vending route is unusual because the store does not come to the operator. The operator repeatedly goes to the store.
That makes geography inside the service map a cost even when no invoice specifically says “route inefficiency.”
Consider two routes with the same $10,000 monthly sales.
| Operating Measure | Route A | Route B |
|---|---|---|
| Monthly sales | $10,000 | $10,000 |
| Installed machines | 11 | 18 |
| Average sales per machine | $909 | $556 |
| Monthly service visits | 28 | 47 |
| Service hours | 31 | 59 |
| Revenue per service hour | $323 | $169 |
Gross revenue makes the routes look identical. Operationally they are not.
Route B has more equipment tied up, more doors to open, more payment devices to maintain, more inventory positions to manage, and almost twice the service hours.
Its product cost could be excellent and it could still struggle to match Route A’s labor efficiency.
Track Revenue and Contribution per Service Hour
Revenue per service hour is easy to calculate and useful as a first screen.
Contribution per service hour is better because it accounts for differences in product margin and location expense.
If I were choosing between an isolated machine with slightly higher projected sales and a slightly smaller account beside three current stops, I would usually favor the clustered opportunity after comparing contribution per service hour.
Do Not Refill Every Machine on the Same Calendar
A fast machine and a slow machine rarely deserve the same schedule.
Service frequency should respond to:
- sales velocity;
- usable capacity;
- product shelf life;
- cleanliness needs;
- cash collection requirements where applicable;
- fault history;
- the cost of a stockout.
| Observed Pattern | Likely Response |
|---|---|
| Frequent stockouts on strong sellers | Add facings, increase capacity, or shorten refill interval |
| Stable sales with plenty of inventory remaining | Consider extending the service interval |
| Low sales and excessive inventory | Reduce depth and service frequency |
| Repeated payment or machine errors | Prioritize a diagnostic visit rather than waiting for the normal refill day |
A connected machine earns part of its value by helping the operator avoid unnecessary visits.
Vending Machine Repair Should Have a System
One faulty motor is a repair. Ten machines with undocumented faults are an operating problem.
Maintenance becomes much easier when the route records failures, keeps a sensible stock of common parts, and standardizes equipment where possible.
Separate Preventive Work From Emergency Work
Preventive maintenance can include cleaning refrigeration areas, checking door seals, inspecting payment hardware, cleaning sensors, testing product delivery, reviewing machine logs, checking locks, examining visible wiring, and confirming temperature performance where refrigeration is used.
Emergency maintenance begins after a critical function has already failed.
Preventive work will not eliminate every breakdown. Its purpose is to reduce preventable failures and catch deterioration before a machine stops selling.
Keep a Repair History by Machine
| Repair Log Field | Why It Is Useful |
|---|---|
| Date and machine ID | Creates an equipment history |
| Reported symptom | Shows how the problem appeared |
| Confirmed cause | Separates symptoms from root faults |
| Part replaced | Improves spare-parts planning |
| Labor time | Reveals the real maintenance burden |
| Downtime | Connects reliability to lost selling time |
| Resolution notes | Builds a reusable troubleshooting history |
After enough entries, the route can see patterns. One machine platform may produce recurring sensor problems. One location may suffer unusual physical damage. One payment reader may lose connectivity more often than the rest.
Those patterns should influence future equipment purchases.
Standardization Is Quietly Valuable
If ten machines use the same motors, locks, sensors, controller architecture, payment hardware, and common service procedure, a compact set of spare parts can support the fleet.
If every machine is different, the operator has to stock more parts and remember more troubleshooting paths.
Specialized equipment can be worth that complexity when it solves a valuable selling problem. Otherwise, I would favor a smaller number of proven configurations.
Measure Downtime as Part of the Repair Cost
If a machine normally generates $45 in daily sales and contributes 38% after variable costs, each full day offline represents roughly $17 in lost contribution before the repair expense itself.
Over seven days, that is about $120. Across a fleet, repeated delays can become more expensive than keeping common replacement parts available.
Calculate Break-Even, Payback, and ROI Before Expanding
The purpose of a route model is not to make the future look precise. It is to expose which assumptions have to be true for the investment to work.
Monthly Break-Even Sales
A simplified break-even calculation can be useful when variable costs are expressed as a percentage of sales.
Suppose fixed and allocated machine costs are $280 per month and the contribution margin after product, payment, location expense, and waste is 40%.
That means the machine needs roughly $700 in monthly revenue before covering the modeled fixed and allocated expenses.
It is not an accounting standard. It is a planning tool.
Simple Payback Period
If a machine requires $4,900 of deployed capital and produces $300 in monthly operating contribution:
Simple payback does not automatically include financing, tax treatment, depreciation, residual value, future refurbishment, or changing sales. It is useful for comparing opportunities when the assumptions are applied consistently.
Return on Deployed Capital
Another simple comparison is annual operating contribution divided by deployed capital.
A machine producing $3,600 in annual operating contribution on $4,900 of deployed capital produces a simple contribution-to-capital ratio of about 73%.
That does not mean a 73% investment return in an accounting sense. It means the operating contribution is equivalent to 73% of the original deployed capital before the exclusions described above.
Use Three Scenarios, Not One
A route forecast should survive more than the optimistic case.
I’d use:
- Downside: sales disappoint and service cost runs slightly high;
- Base: reasonable traffic, normal costs, and expected uptime;
- Strong: location performs above plan without unusual cost increases.
If the investment only looks sensible in the strong case, the location is fragile.
Know When a Machine Should Be Moved
Relocating equipment is disruptive, so weak stops often remain in place longer than they should.
I would give an underperforming location a defined improvement period rather than an indefinite second chance.
The plan might include:
- replace poor-selling products;
- increase depth on proven products;
- review selling prices;
- fix cashless-payment problems;
- improve visibility inside the property;
- reduce unnecessary refill frequency;
- review commission terms.
If the machine still cannot clear the required contribution threshold, moving it may be more rational than defending the original placement decision.
Why Sales Per Machine Matter More Than Machine Count
Machine count is easy to communicate, so it receives too much attention.
A 50-machine route sounds larger than a 25-machine route. It may also require nearly twice the invested capital, twice the payment hardware, more storage, more repairs, and substantially more labor.
The better question is what the fleet produces for each unit of capital and service time.
| Fleet Metric | What It Reveals |
|---|---|
| Average sales per machine | Whether capital is placed in productive accounts |
| Average contribution per machine | Whether sales translate into usable operating profit |
| Contribution per service hour | Whether the route converts labor efficiently |
| Revenue per deployed dollar | Whether equipment capital is being used productively |
| Uptime | Whether the installed fleet is actually available to sell |
If I were choosing between adding ten marginal machines and five strong machines at similar total capital, I would rank the five stronger accounts higher unless the ten-machine option offered some unusual strategic benefit.
Fewer doors can mean fewer refill decisions, fewer repair events, fewer payment subscriptions, and less cash sitting in inventory.
Buying an Existing Vending Machine Route
Buying existing accounts can shorten the time required to build a route, but only when the seller’s numbers can be reconstructed.
A route should not be valued from machine count or annual revenue alone.
Ask for Machine-Level Sales
Route totals hide weak equipment.
A $150,000 route might have five outstanding machines carrying twenty mediocre ones. Machine-level records expose the distribution.
For each location, review:
- historical sales;
- cashless processor records where available;
- placement commissions or rent;
- product cost;
- service frequency;
- distance and service time;
- repair history;
- equipment age;
- machine ownership;
- payment-device subscriptions;
- inventory included in the purchase;
- written placement agreements.
Rebuild the Profit Statement
If a seller says the route “makes 30%,” define the 30%.
Does it include route labor? Vehicle expense? Repairs? Card fees? Warehouse rent? Insurance? The owner’s time?
Reconstruct the statement from source records instead.
| Item | Evidence Worth Reviewing |
|---|---|
| Gross sales | Machine reports, processor reports, deposits, and accounting records |
| Product cost | Supplier invoices and inventory records |
| Placement expense | Contracts and payment records |
| Payment cost | Processor statements and device subscriptions |
| Service burden | Actual visit frequency and realistic drive/service time |
| Repair cost | Parts invoices, technician records, and machine history |
| Equipment ownership | Purchase invoices, serial numbers, finance documents, or lien information |
Confirm That the Locations Transfer
A profitable machine is valuable partly because it is in a profitable location.
If the placement agreement ends when ownership changes, the buyer may be purchasing equipment without purchasing the account.
That should be resolved before a value is assigned to location goodwill.
Value the Components Separately
The machines have equipment value. Inventory has inventory value. Vehicles and spare parts have their own values. The accounts may have earnings value.
Breaking the purchase into those components makes it easier to see what is actually being bought.
A Practical 90-Day Plan for a New Vending Machine Route
A new route does not need to begin with a large fleet. The first machines should teach the operator enough to make later machines easier.
Weeks 1–2: Define the Economics
Set a target deployed cost, minimum monthly contribution, preferred payback range, and a maximum service burden for a normal machine.
Create the location scorecard before evaluating opportunities.
Choose the product category and define the likely machine format, but do not lock the final hardware configuration until a real location and real assortment are known.
Weeks 3–5: Qualify Locations
Walk the actual machine position. Observe traffic at useful times rather than relying only on property estimates.
Document nearby purchase alternatives, expected operating hours, placement terms, refill access, power, connectivity, and security.
Reject locations that cannot clear the route’s economic floor.
Weeks 6–7: Finalize the Machine Specification
Provide product dimensions and samples where practical. Confirm cargo lanes, delivery mechanism, cooling, payment devices, connectivity, branding, software requirements, and spare parts.
Create a machine record containing its serial number, configuration, payment-device details, warranty information, planned location, and initial assortment.
Weeks 8–9: Install and Test
During installation, confirm:
- machine level and stability;
- door and service clearance;
- power supply;
- network connection;
- payment authorization;
- refrigeration where applicable;
- pricing;
- product delivery;
- remote reporting;
- pickup access.
Run several test purchases before leaving the site.
Weeks 10–13: Learn Before Expanding
The early route needs observation more than rapid growth.
Rank products by unit volume and contribution. Watch stockouts. Look for repeated payment problems. Measure how long each service visit actually takes.
A machine that looked excellent in a spreadsheet may reveal an inconvenient refill process. A product expected to sell slowly may become a top seller.
Use those lessons before ordering the next group of machines.
A Worked 12-Machine Route Model
The following example is a planning model, not a claimed customer result.
Assume twelve machines settle at an average of $900 in monthly sales. Total monthly sales are $10,800.
Product cost, payment expense, location costs, and shrink together consume an average of 64% of revenue.
| Route Measure | Illustrative Monthly Result |
|---|---|
| Machines | 12 |
| Average sales per machine | $900 |
| Total sales | $10,800 |
| Variable costs at 64% | -$6,912 |
| Contribution after variable costs | $3,888 |
| Route service, vehicle, maintenance, and operating allocation | -$1,500 |
| Illustrative operating contribution | $2,388 |
That route does not become healthier simply by adding a thirteenth machine.
If the thirteenth stop produces $350 in sales and requires a separate service trip, it may weaken the average. If it produces $900 beside three current stops, it may improve route density.
The better expansion decision is the one that improves the system rather than the machine count.
What Happens When the Assortment Improves?
Suppose sales data shows that 16 of 40 selections produce 70% of unit volume.
The route gives those products additional depth, removes several chronic slow sellers, and keeps a small group of lanes available for controlled tests.
That change may not increase total assortment variety. It can still improve revenue because the machine holds more of what customers repeatedly buy.
What Happens When Service Improves?
Two high-volume machines originally require frequent visits because core products keep selling out.
After the lane mix is changed, additional facings allow one service visit to be removed from the schedule.
At the same time, three slower machines move to longer refill intervals.
The route can reduce monthly service hours without reducing customer availability.
That is the kind of improvement I would rather see than a new machine added for the sake of growth.
The Weekly Numbers I Would Keep on One Page
A route dashboard does not need dozens of metrics. It needs the numbers that change decisions.
| Metric | What It Shows | Possible Response |
|---|---|---|
| Sales per machine | Location productivity | Investigate meaningful declines |
| Contribution per machine | Whether sales are profitable | Review cost, price, commission, or service |
| Sales per SKU | Product productivity | Change facings or assortment |
| Stockout rate | Lost-sales risk | Add capacity or service more often |
| Waste rate | Overstocking or poor product fit | Reduce depth or replace the item |
| Contribution per service hour | Route labor efficiency | Reschedule or reconsider the stop |
| Cashless share | How customers are paying | Check reader reliability and payment setup |
| Refund or failed-vend rate | Customer-experience problem | Inspect delivery mechanism and configuration |
| Machine uptime | Equipment availability | Escalate recurring faults |
| Repair cost per machine | Maintenance burden | Repair, refurbish, or replace chronic problem units |
A sudden sales decline deserves attention because it may not be a demand problem.
The cause could be a failed card reader, empty top-selling lane, refrigeration fault, machine communication problem, blocked placement, changed building traffic, or a price error.
A smart vending system is most useful when it helps identify the difference quickly.
Mistakes That Make Vending Routes More Expensive
Buying Machines Before Locations Are Ready
A machine in storage produces no revenue and creates pressure to accept the next available placement.
Qualify the location first whenever the project allows it.
Accepting a Location Because It Is Free
No commission does not mean no cost.
A machine producing $180 in monthly sales can still waste labor and capital even when the property charges nothing.
Choosing Hardware by Purchase Price Alone
A machine that saves $400 at purchase can become the more expensive unit if it produces repeated service calls, lacks useful telemetry, or cannot handle the intended products reliably.
Compare deployed cost and operating cost.
Keeping Too Much Inventory in Slow Products
Slow merchandise ties up working capital, occupies selling space, and increases waste risk.
Deep inventory belongs behind proven velocity.
Refilling by Habit
A half-full machine does not need a visit because it happens to be Tuesday.
Use real stock and sales information where available.
Allowing Weak Locations to Become Permanent
Winning a location can take significant effort. That effort is already spent.
It does not make the next twelve months of service profitable.
Give underperforming machines an improvement plan and a review date.
Expanding Before Repairs Are Organized
Growth multiplies maintenance events.
Build the repair log, parts kit, and escalation process before the fleet becomes difficult to manage.
Looking Only at Sales
A $2,000 machine with high commission, frequent refill trips, expensive merchandise, and repeated technical failures can contribute less than a quiet $1,100 account.
The route should be managed by contribution and service burden, not attractive gross-sales screenshots.
When a Vending Machine Route Is Ready to Grow
A route is ready for another machine when the current operation is predictable enough that additional volume will not magnify unresolved problems.
I would want clear answers to five questions:
- Are existing locations clearing the contribution target?
- Can core products stay in stock without emergency refills?
- Can the route be serviced within predictable working hours?
- Are common machine faults being resolved quickly?
- Can the business fund another machine and its inventory without weakening current operations?
If those answers are mostly yes, growth becomes easier to absorb.
If the answers are no, additional machines tend to add more noise than profit.
Favor Clusters
A clustered route creates leverage. One vehicle trip can service several machines. Spare stock can be redistributed more easily. A technician can respond faster. New locations can often be approached around an existing service area.
A distant account can still be worth taking, but it should pay for its isolation.
Do Not Let Capacity Force Growth
It is common to feel that available cash, warehouse space, or a good machine price means it is time to expand.
Capacity to buy is not the same as a good reason to deploy.
I’d rather see capital wait for a strong location than see equipment placed somewhere merely to keep it busy.
What a Mature Vending Route Should Feel Like
A good route becomes less dramatic as it improves.
Refill quantities are reasonably predictable. The warehouse knows what to prepare. Core machines share parts. The operator knows which locations deserve attention. Product changes are driven by sales instead of guesswork.
Repairs are documented. Strong locations are easy to identify. Weak ones do not survive indefinitely.
Cash flow from existing equipment starts to support expansion. The service map becomes denser rather than merely larger.
That is the business I would try to build: not a collection of vending machines, but an installed retail network in which each stop has a reason to exist.
Have the numbers? Now specify the machine around the route.
Zhongda Smart manufactures configurable commercial vending machines for operators, distributors, and branded self-service projects. Share your product dimensions, capacity target, refrigeration needs, preferred payments, and expected quantity to discuss a suitable configuration and quotation.
Frequently Asked Questions
How many machines do you need for a profitable vending machine route?
There is no machine count that guarantees profit. One strong machine can generate positive contribution while ten poor machines can consume cash and labor. Set a minimum contribution target for each location and expand after existing machines are performing predictably. A compact group of high-quality stops is usually easier to manage than a larger group of scattered low-volume machines.
How much can one vending machine make per month?
Monthly sales vary widely by qualified traffic, dwell time, operating hours, product prices, competition, assortment, payment methods, machine uptime, and refill quality. NAMA's 2022–2023 census figures imply an average of roughly $6,284 in annual vending revenue per machine across its 2023 forecast dataset, or about $524 per month, but that average should not be treated as an earnings expectation for an individual machine. Location-specific economics matter much more.
What makes a good vending machine location?
A strong location has repeat users, enough dwell time to create purchase occasions, visible machine placement, a clear convenience need, manageable competition, practical service access, reliable power and connectivity, and placement terms that leave enough margin. Evaluate the exact machine position rather than judging the property only by total traffic.
How do you calculate vending machine route profitability?
Start with machine sales and subtract product cost, payment expense, placement commission or rent, waste, shrink, direct route servicing, and a realistic maintenance allowance. Then include route-level costs such as vehicle expense, insurance, storage, administration, financing, and labor. Tracking contribution by individual machine prevents a few strong locations from hiding weak ones.
Should vending machines accept cashless payments?
Cashless acceptance deserves serious consideration for most modern commercial vending operations. Cantaloupe's 2026 Micropayment Trends Report says 78% of food-and-beverage vending sales in its 2025 dataset were cashless, with contactless payments representing 85% of cashless vending sales. Payment configuration should still be chosen according to customer behavior, processing cost, machine compatibility, network reliability, and the payment providers available to the project.
How often should a vending machine be restocked?
Restocking frequency should follow sales velocity, usable machine capacity, shelf life, cleanliness requirements, and stockout risk rather than a fixed calendar. A fast machine may need frequent service while a slower machine can often wait much longer. Remote inventory data can help schedule visits according to what the machine actually needs.
Is it better to buy a new or used vending machine?
Used equipment can reduce initial capital cost, but remaining service life, refrigeration condition, payment compatibility, controller availability, parts supply, lock condition, and repair history should be checked carefully. New equipment may offer better standardization, configuration control, and warranty support. For a fleet intended to grow, I would give significant weight to shared parts and remote-management compatibility.
When should an underperforming vending machine be moved?
Give the location a defined improvement period first. Review assortment, pricing, visibility, payment reliability, refill frequency, stockouts, and placement terms. If the machine still cannot meet the minimum contribution target after reasonable corrections, relocation may be a better use of the equipment than continuing to service a weak stop.
When should a vending route add another machine?
Expand after the current fleet has stable sales, reliable payment, controlled inventory, manageable maintenance, and predictable service hours. The next location should ideally improve route density and meet the same financial standards as the existing accounts. Growth is most valuable when the new machine strengthens the operating system rather than merely increasing the fleet count.
Sources and Reference Material
- NAMA Foundation — 2022–2023 Industry Census. Industry census covering vending-machine counts, vending revenue, operator trends, locations, and convenience-service performance. View the NAMA Industry Census.
- Cantaloupe — Micropayment Trends Report 2026. Current self-service transaction data covering cashless share, contactless payment, and vending transaction values. View the 2026 Micropayment Trends Report.
- PCI Security Standards Council. Standards, guidance, and payment-security resources relevant to unattended payment environments. View PCI Security Standards Council resources.
- GS1 — Barcode Standards. Reference material covering standardized product identifiers and barcode systems used in retail and inventory workflows. View GS1 barcode standards.
Final Perspective
A profitable vending machine route is built through a series of ordinary decisions made consistently well.
The location has to support enough real demand. The placement terms have to leave room for margin. The machine has to match the product. Payment has to be easy. The strongest products have to stay available. Inventory has to turn rather than sit. Repairs need a system. Route service has to become denser as the fleet grows.
None of those decisions is especially complicated by itself. The economics improve when they reinforce one another.
A high-capacity machine can reduce refill labor, but only when the location sells enough to use the capacity. Remote inventory can save visits, but only when the operator actually changes the service schedule. Cashless payment can reduce transaction friction, but only when the reader stays connected and the fees are understood. Custom hardware is valuable when it solves product or operating problems, not simply because it is custom.
For this comparison, I’m prioritizing repeatability over rapid expansion. A route that knows why each machine is profitable is in a much better position to add the next ten machines than a route that grew quickly and plans to understand the numbers later.
That is also the standard I would use when selecting equipment: buy the configuration that supports the route you want to operate, not the machine with the longest feature list.