Pricing can have a major impact on vending machine profitability, but the right selling price is rarely as simple as multiplying wholesale cost by two or copying the price used by another machine.
A more reliable vending machine pricing strategy starts with the true cost of selling each item, then considers location, payment fees, commissions, product turnover, competition, customer convenience, and the profit contribution generated by each machine slot.
From an editorial standpoint, we recommend treating vending machine pricing as an ongoing operating decision rather than a one-time setup task. The goal is not to charge the highest possible price for every product. The better objective is to find a price that produces sustainable profit while maintaining acceptable sales volume and customer value.
Quick answer: calculate the true unit cost first, determine the gross profit or contribution you need, compare nearby alternatives, adjust for the location, and then validate the price using actual sales data. Small, measured price adjustments are generally more useful than relying on a fixed markup rule across every product and machine.
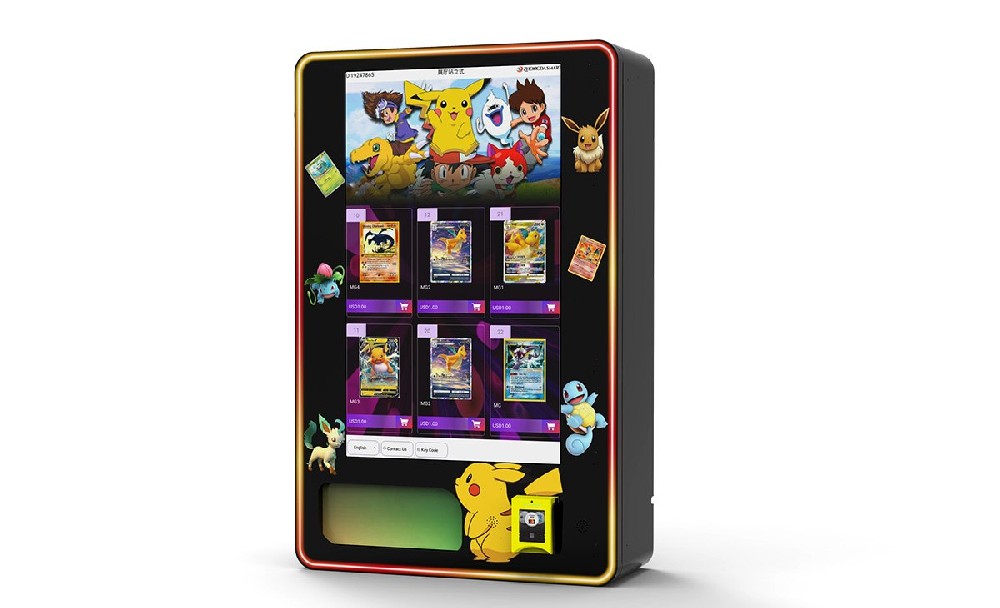
Table of Contents
- Calculate the True Cost of Every Vending Machine Item
- Use the Right Vending Machine Pricing Formula
- Understand Markup vs. Profit Margin
- Adjust Vending Prices by Location
- Build a Tiered Product and Price Mix
- Account for Cashless Payment Fees
- Include Location Commissions and Applicable Taxes
- Use Smart Vending Technology for Price Testing
- Measure Profit per Slot, Not Just Sales Volume
- Price Specialty Vending Products Differently
- Consider Machine Presentation and Customer Experience
- Avoid Common Vending Machine Pricing Mistakes
- A Practical Vending Machine Pricing Workflow
- Frequently Asked Questions
- Editorial, Financial and Compliance Disclaimer
1. Calculate the True Cost of Every Vending Machine Item
One of the most common vending machine pricing mistakes is treating wholesale product cost as the complete cost of a sale.
If a bottled drink costs $0.89 from a distributor, that does not necessarily mean $0.89 is the operator's break-even cost. Depending on the business model, additional expenses can include card-processing charges, location commissions, product loss, spoilage, restocking expenses, software subscriptions, equipment costs, and applicable taxes.
For pricing purposes, we recommend calculating a true unit cost for each important SKU.
A practical framework is:
True Unit Cost = Product Cost + Payment Cost + Commission + Expected Product Loss + Allocated Operating Cost + Other Applicable Costs
Consider the following simplified example. The figures are illustrative and should not be interpreted as industry-standard costs.
| Cost Component | Illustrative Amount |
|---|---|
| Wholesale product cost | $0.89 |
| Estimated payment-processing allocation | $0.14 |
| Allocated machine/service expense | $0.04 |
| Spoilage, shrinkage and restocking allowance | $0.10 |
| Illustrative true unit cost | $1.17 |
In this example, pricing from the $0.89 wholesale figure would understate the economic cost of the sale. The $1.17 figure is more useful when evaluating possible retail prices.
Actual costs can be substantially different. Operators should calculate their own numbers using supplier invoices, payment-provider agreements, route expenses, machine costs, location contracts, product-loss records, and local tax requirements.
Businesses still evaluating the total investment required for vending equipment can also review our detailed guide to vending machine costs before building a product-level pricing model.
2. Use the Right Vending Machine Pricing Formula
There is no universal vending machine markup that works for every product and every location.
A fixed multiplier can be useful as a quick screening tool, but we do not recommend using it as the final pricing method. Two products with identical wholesale costs may have very different spoilage risks, payment costs, demand levels, commissions, or competitive conditions.
A more useful formula starts with the target margin:
Selling Price = True Unit Cost ÷ (1 − Target Gross Margin Rate)
For example, if true unit cost is $1.17 and the operator is evaluating a 50% gross-margin target, the mathematical starting price would be approximately $2.34 before considering market positioning, local competition, customer expectations, or price-rounding decisions.
That does not mean $2.34 is automatically the correct retail price. It simply provides a financial reference point.
The next step is to ask whether customers in that specific location are likely to accept a price around that level and whether a slightly higher or lower price produces a better total profit result.
This distinction matters because vending machine pricing should optimize the economics of the entire machine, not merely the theoretical margin percentage of one product.
3. Understand Markup vs. Profit Margin
Markup and margin are frequently confused in vending machine pricing discussions.
Markup measures profit relative to cost. Gross margin measures gross profit relative to the selling price.
For example, if an item costs $1.00 and sells for $2.00, the markup on cost is 100%. However, the gross margin is 50%, because $1.00 of gross profit represents half of the $2.00 selling price.
This difference becomes increasingly important as operators manage more machines and compare product categories.
We recommend choosing one consistent measurement method for internal pricing reports. Gross profit dollars, gross margin, and profit contribution per slot can all be useful, but they should not be mixed together without clear definitions.
4. Adjust Vending Prices by Location
The same vending product does not necessarily need the same price at every location.
A bottle of water inside an office building, airport, hotel, hospital, university, factory, apartment complex, gym, or transportation hub is being purchased under a different set of circumstances.
Location affects both convenience value and customer alternatives.
Before approving a vending machine price, we recommend evaluating three basic questions:
- What comparable products can customers buy nearby?
- How much time or effort would it take to reach those alternatives?
- How important is immediate convenience in this location?
A machine inside a controlled environment with limited alternatives may support a different pricing structure from a machine positioned beside a convenience store or food court.
Location commissions also influence this calculation. A high-traffic location is not automatically more profitable if the placement agreement absorbs a large percentage of revenue.
For multi-machine operators, our preferred approach is to create a common pricing framework while still allowing location-specific adjustments.
A Simple Location Classification Model
| Location Type | Typical Characteristics | Pricing Consideration |
|---|---|---|
| High Convenience | Limited immediate alternatives and strong need for convenience | May support greater pricing flexibility |
| Balanced Convenience | Some alternatives nearby but vending remains convenient | Balance margin with competitive reference prices |
| Highly Competitive | Convenience stores, cafés, food courts or retailers nearby | Greater price sensitivity may require tighter positioning |
These categories are planning tools rather than fixed pricing rules. Actual customer behavior should be measured after installation.
5. Build a Tiered Product and Price Mix
A profitable vending machine does not necessarily need every product to deliver the same percentage margin.
We generally prefer a tiered assortment containing accessible products, core profit generators, and premium products.
| Product Tier | Typical Examples | Primary Role |
|---|---|---|
| Value | Water, basic snacks, familiar staples | Maintain accessibility and encourage repeat use |
| Core | Mainstream drinks, snacks, candy and meals | Generate consistent daily profit contribution |
| Premium | Protein products, specialty beverages and niche products | Increase profit dollars per transaction and expand choice |
A tiered structure helps avoid a machine where every item sits inside the same narrow price range.
It can also create better product comparisons. Customers looking for the lowest-cost option can still find one, while customers willing to pay more for a premium or specialized product have a clear alternative.
From an assortment perspective, premium products should still justify the physical space they occupy. A high-margin product that rarely sells may generate less value than a moderately priced product with stronger turnover.
6. Account for Cashless Payment Fees
Modern vending machines increasingly support credit cards, debit cards, mobile wallets, QR payments, and other cashless methods.
These payment options can improve convenience, but they also introduce transaction costs that should be reflected in the pricing model.
The exact fee structure depends on the payment provider, country, acquiring arrangement, equipment platform, and commercial agreement.
Lower-priced products deserve particular attention because a fixed transaction component can represent a larger percentage of a small purchase.
We recommend analyzing net revenue after payment costs rather than evaluating vending revenue alone.
Whether payment costs should be incorporated into the displayed product price or handled in another manner depends on applicable law, payment-network rules, contractual requirements, and local consumer-pricing regulations.
Operators should verify those requirements before introducing a visible payment surcharge.
7. Include Location Commissions and Applicable Taxes
Location commissions can materially change vending machine profitability.
If the building owner, employer, property manager, school, gym, hotel, or other site partner receives a percentage of vending revenue, that expense should be included in the economic model before the selling price is approved.
Consider a simplified example. If two machines sell the same product at the same retail price but only one location requires a meaningful revenue commission, the two machines do not have the same net profitability.
This is another reason we do not recommend applying identical prices blindly across an entire vending route.
Taxes require similar care.
Sales tax, VAT, GST, food taxation, beverage taxes, bottle deposits, and price-display requirements can vary by country, state, province, municipality, and product category.
Some jurisdictions may allow or require taxes to be included in the displayed price, while others may have different requirements.
Operators should verify the correct treatment with a qualified local accountant, tax professional, or relevant government authority instead of relying on a generic online pricing formula.
8. Use Smart Vending Technology for Price Testing
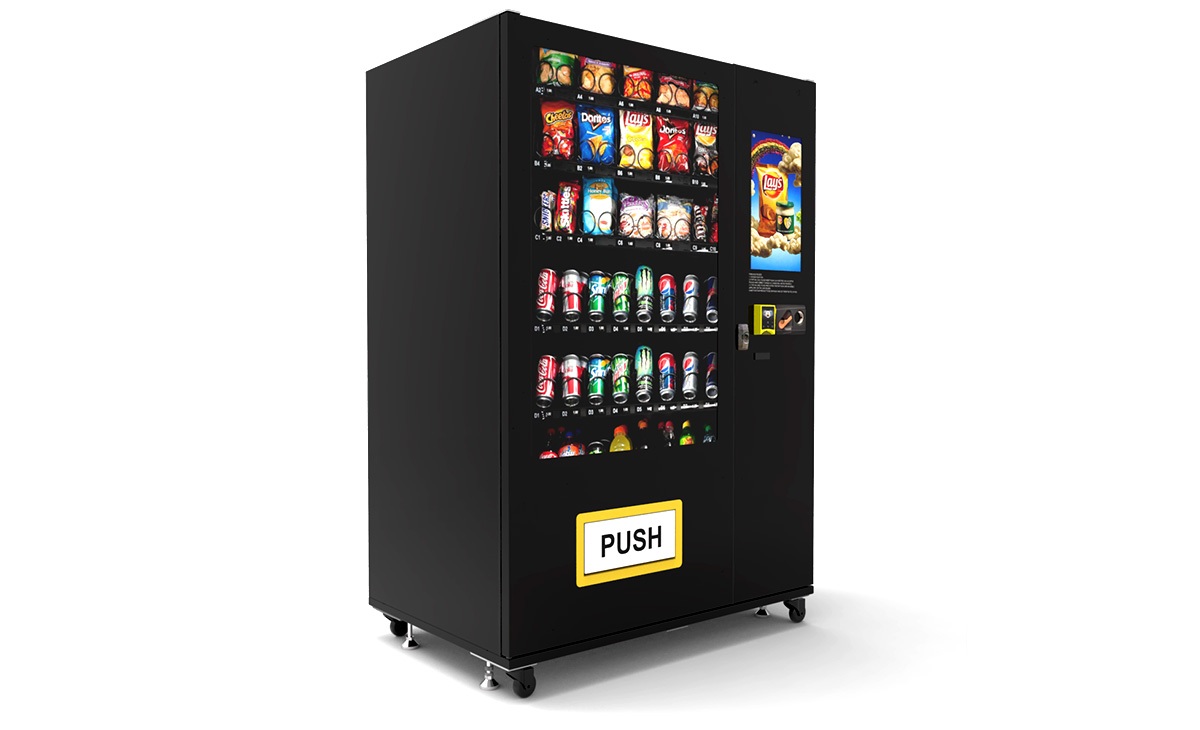
One of the practical advantages of a modern smart vending machine is that pricing can be managed more efficiently.
Depending on the hardware and vending management platform, operators may be able to update prices remotely, review inventory, compare SKU performance, create promotions, and analyze sales without visiting every machine.
From our editorial perspective, the most valuable benefit is not aggressive dynamic pricing. It is the ability to run controlled pricing tests with less operational friction.
For example, an operator can increase the price of one high-volume SKU by a modest amount, monitor what happens to unit sales and gross profit, and compare the result with the previous period.
If unit sales decline slightly but total profit increases, the new price may be more effective. If sales decline sharply and total contribution falls, the operator has evidence that the previous price was closer to the acceptable range.
Whenever possible, change one major variable at a time. Simultaneously changing the price, product position, package size, promotion, and assortment can make it difficult to determine what caused the result.
Businesses that require remote price management, configurable product channels, inventory monitoring, cashless-payment integration, or customized dispensing systems can review our OEM custom vending machine solutions when evaluating equipment requirements.
What About Dynamic Pricing?
Some vending platforms may support scheduled prices, promotional prices, time-based rules, or other automated pricing functions.
These capabilities can be useful, but dynamic pricing should be applied carefully.
Operators should consider customer expectations, transparency, local consumer-protection requirements, payment rules, contractual obligations, and the risk that frequent unexplained price changes could reduce trust.
For most vending businesses, we recommend mastering accurate cost accounting and basic price testing before introducing more complex dynamic-pricing strategies.
9. Measure Profit per Slot, Not Just Sales Volume
Sales volume is important, but volume alone does not determine whether a product deserves space inside a vending machine.
Every coil, shelf, locker, drawer, or product channel has limited capacity. That makes vending machine space an economic resource.
For assortment and pricing decisions, one of the most useful measurements is:
Profit Contribution per Slot over a Defined Period
Imagine Product A sells 20 units during a period and generates $0.35 of contribution per sale. Product B sells only 14 units but generates $0.80 of contribution per sale.
Product A contributes $7.00, while Product B contributes $11.20 during the same period.
In this example, the slower-selling item creates more economic value for the slot.
This does not mean every high-margin product should replace a high-volume product. Traffic, assortment balance, stock availability, customer expectations, and restocking frequency also matter.
The point is that vending operators should evaluate more than unit sales.
Useful Metrics to Track
- Units sold by SKU
- Revenue by SKU
- True unit cost
- Gross profit dollars
- Gross margin
- Profit contribution per slot
- Days of inventory remaining
- Stockout frequency
- Product expiration or shrinkage
- Location commission
- Payment-processing cost
- Restocking frequency
A simple spreadsheet can be sufficient for a small route. Larger operations may benefit from vending management software that collects machine-level and SKU-level data automatically.
Operators considering a new location or machine can also use our Vending Machine ROI Calculator to compare different equipment, pricing, cost, and sales assumptions.
Any calculator result should be treated as a planning estimate rather than a guarantee of future revenue or profitability.
10. Price Specialty Vending Products Differently
Traditional snack and beverage pricing principles do not automatically transfer to every vending category.
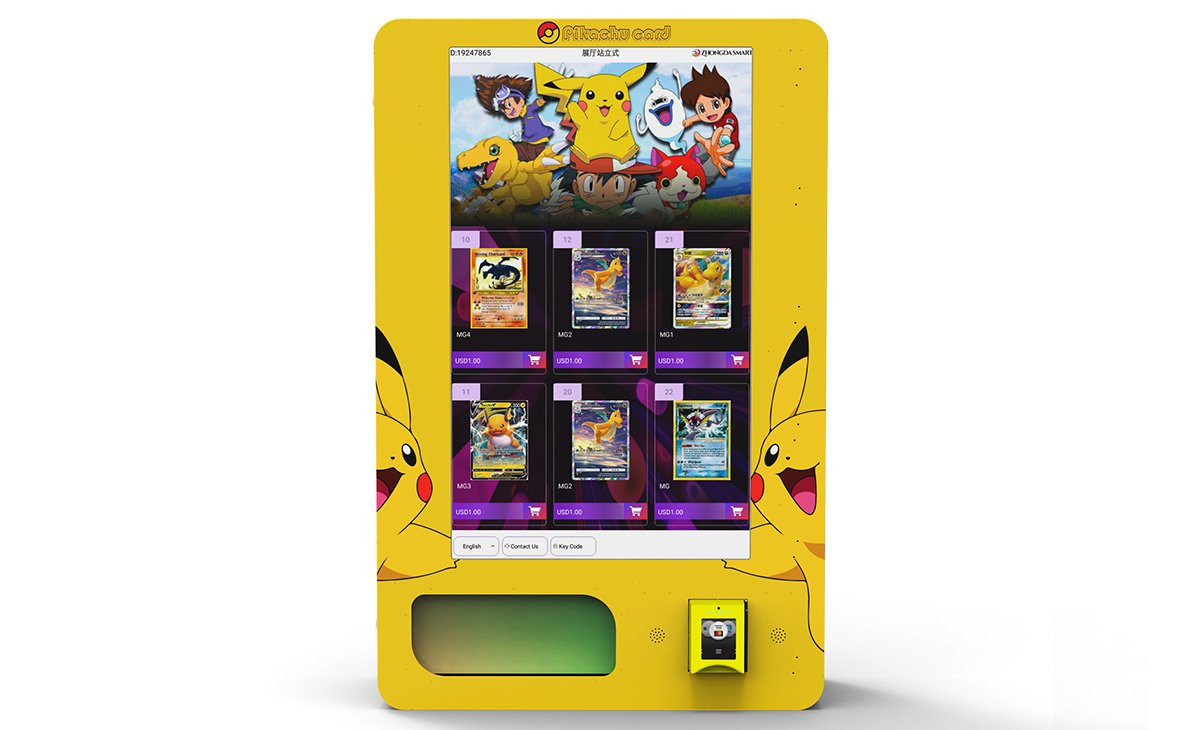
Today's vending machines can be configured for cosmetics, electronics accessories, toys, collectibles, personal-care products, fresh food, frozen food, flowers, pharmacy-related non-prescription retail products, tools, PPE, and many other merchandise categories.
Specialty products can have very different economics because purchase frequency, product value, replacement alternatives, packaging, theft risk, expiry risk, and customer intent are different.
For higher-value specialty products, we recommend paying greater attention to absolute profit dollars per transaction rather than percentage margin alone.
Product form factor also matters.
A spiral coil that works well for a bag of chips may not be appropriate for fragile electronics, boxed cosmetics, irregular packages, or higher-value merchandise. In those situations, the dispensing system should be considered together with the pricing strategy.
Businesses evaluating different configurations can compare the Zhongda Smart vending machine product range to review different machine formats and product-delivery options.
11. Consider Machine Presentation and Customer Experience
Price is only one part of the customer's purchase decision.
Machine cleanliness, lighting, product visibility, touchscreen quality, payment convenience, temperature control, product organization, price clarity, and overall condition can all influence how customers perceive the offer.
From an editorial perspective, pricing and machine presentation should therefore be managed together.
Before increasing prices, inspect the machine from the customer's point of view.
Is the glass clean? Are products easy to identify? Are prices clearly displayed? Does the payment system work reliably? Is the interface understandable? Does the machine appear professionally maintained?
A premium pricing strategy becomes harder to support if the buying experience communicates poor maintenance or uncertainty.
Reliable dispensing is equally important. A machine that regularly fails to deliver products or accept payments can damage repeat usage regardless of how carefully prices are calculated.
12. Avoid Common Vending Machine Pricing Mistakes
Pricing Only From Wholesale Cost
Wholesale cost is only one input. Ignoring payment expenses, commissions, shrinkage, service costs, taxes, or operating expenses can create misleading margin estimates.
Using the Same Markup on Every Product
Fresh food, bottled beverages, inexpensive snacks, premium drinks, and specialty merchandise have different economics. A single markup percentage may not produce the best result across every category.
Copying Competitor Prices Without Knowing Their Costs
Competitor pricing is useful market information, but another operator may have lower product costs, different placement commissions, different equipment expenses, or a different strategic objective.
Confusing Markup With Margin
A 100% markup does not mean a 100% gross margin. Using inconsistent financial definitions can create poor pricing decisions.
Ignoring Location Commissions
A location that receives part of gross revenue changes the unit economics of every sale. Commission should be included before the final price is approved.
Focusing Only on Percentage Margin
Percentage margin is useful, but profit dollars, sales velocity, inventory turnover, stockouts, and profit contribution per slot also matter.
Leaving Prices Unchanged Indefinitely
Supplier prices, package sizes, payment costs, taxes, commissions, and competitive conditions can change. Pricing should therefore be reviewed periodically using current operating data.
Changing Too Many Variables at Once
If an operator changes prices across the entire machine while also changing the assortment and product positions, it becomes difficult to understand what caused the performance change.
Using Unsupported Profit Claims
Pricing should be based on the economics of the actual machine rather than generic claims such as a particular product always producing a certain margin or a pricing technique guaranteeing a specific revenue increase.
Vending profitability varies substantially according to equipment cost, location quality, customer demand, product mix, commissions, operating efficiency, and many other factors.
13. A Practical Vending Machine Pricing Workflow
For most vending operations, we recommend using the following sequence:
Calculate True Unit Cost → Set a Required Profit Target → Evaluate the Location → Compare Nearby Alternatives → Select an Initial Price → Monitor Sales and Profit → Adjust Gradually
This approach is intentionally straightforward.
Advanced vending software can improve reporting and reduce the effort required to change prices, but technology cannot compensate for an inaccurate cost model.
Accurate product costs should therefore come first.
After that foundation is established, remote management, inventory monitoring, automated reporting, and configurable pricing functions can shorten the feedback loop between a pricing decision and its measurable result.
Businesses comparing machine configurations for different products and operating models can review our vending machine solutions overview .
How to Know When a Vending Price Is Too High
A price increase is not automatically unsuccessful simply because unit sales decline.
What matters is whether the total economic contribution improves or deteriorates.
Suppose an item sells fewer units after a price increase but generates more total gross profit during the same period. From a financial perspective, the higher price may still be preferable.
On the other hand, a sharp decline in unit sales, repeated customer complaints, increasing product age, or materially lower total contribution can indicate that the price has moved beyond an acceptable range.
We recommend comparing before-and-after results across a meaningful period while also considering unusual factors such as holidays, weather, building occupancy, events, stockouts, and product changes.
How Often Should Vending Machine Prices Be Reviewed?
There is no single review schedule that fits every vending business.
High-volume products generally deserve more frequent attention because small pricing differences can have a larger cumulative financial effect.
Slower products may need less frequent price adjustments but more attention to inventory age and product rotation.
At minimum, pricing should be reconsidered when there is a meaningful change in:
- Wholesale product cost
- Product or package size
- Payment-processing costs
- Location commission
- Tax treatment
- Nearby competition
- Customer traffic
- Machine operating cost
- Sales velocity
- Product expiration risk
The objective is not to change prices constantly. It is to prevent outdated assumptions from quietly reducing profitability.
14. Frequently Asked Questions
What is the best formula for pricing vending machine items?
A useful starting point is to calculate the complete unit cost and then determine the retail price required to produce the target gross margin. One commonly used financial formula is:
Selling Price = True Unit Cost ÷ (1 − Target Gross Margin Rate)
The calculated result should then be checked against the specific location, nearby competition, customer expectations, and actual sales performance.
How much should I mark up vending machine products?
There is no universal markup that applies to every vending machine. Product type, wholesale cost, payment fees, location commissions, spoilage, operating expenses, competition, and customer convenience all influence the sustainable selling price.
We recommend treating a markup percentage as a starting reference rather than a fixed rule.
What profit margin should a vending machine have?
A suitable margin depends on the economics of the individual operation. Operators should distinguish between product-level gross margin and final business profit after equipment, labor, transportation, commissions, software, taxes, repairs, and other operating expenses.
A product showing an attractive gross margin does not automatically mean the machine or route is highly profitable.
Should every vending machine use the same prices?
Not necessarily. Machines can have different customer profiles, location commissions, competitive alternatives, operating costs, demand patterns, and convenience value.
A standardized pricing methodology is useful, but the final retail price may reasonably differ by location.
Should credit card fees be added to vending machine prices?
Payment-processing expenses should be included in the financial model. Whether those costs may be incorporated into the displayed product price, charged separately, or handled in another way depends on local law, contractual terms, payment-network requirements, and the payment provider.
Operators should verify the applicable requirements before implementing a surcharge.
How should location commission be included in vending pricing?
Location commission should be treated as part of the cost of generating the sale. Because commission structures vary, operators should calculate the actual financial impact under their placement agreement rather than applying a universal percentage.
How often should I change vending machine prices?
Prices should be reviewed when important cost or market conditions change. High-volume SKUs may justify more frequent monitoring, while slower products may be reviewed together with inventory rotation.
Price changes should ideally be based on actual sales and cost data rather than a fixed calendar alone.
Can smart vending machines change prices remotely?
Many modern vending-management systems support remote price management, although the exact functionality depends on the machine controller, payment system, vending software, and configuration.
Businesses that require scheduled pricing, promotional pricing, inventory-based rules, or other advanced functions should confirm those capabilities with the equipment supplier before purchasing.
Is dynamic pricing suitable for vending machines?
It can be suitable in some operating environments, but it should be implemented carefully. Operators should consider technical capability, customer expectations, price transparency, contracts, consumer-protection requirements, and applicable local laws.
What is the most important vending machine pricing metric?
No single metric explains the entire business. However, profit contribution per machine slot can provide more useful information than sales volume alone because it considers how economically each product uses limited vending capacity.
Can lowering vending prices increase profit?
In some situations, yes. A lower price can increase turnover enough to produce more total contribution. In other cases, lower pricing only reduces margin without generating enough additional sales.
The result should be determined from actual machine data rather than assumed in advance.
Can higher vending prices increase profit?
Potentially. If a modest price increase produces only a small reduction in sales volume, total profit contribution may improve. If demand falls sharply, the opposite may happen.
This is why controlled price testing is generally more useful than guessing.
Does the appearance of a vending machine affect pricing?
Machine presentation can influence customer perception and purchase confidence. Cleanliness, product visibility, lighting, payment reliability, interface clarity, maintenance, and overall appearance should therefore support the intended price positioning.
Final Takeaway: Price for Sustainable Profit, Not Maximum Markup
The best price for a vending machine product is not automatically the highest price customers will tolerate, the lowest price in the surrounding area, or a fixed multiple of wholesale cost.
From our editorial perspective, the stronger approach is to evaluate true unit cost, profit contribution, location, competition, payment costs, commissions, product turnover, and customer convenience together.
Start with accurate costs. Establish a financially sensible initial price. Compare it with the realities of the location. Then monitor how the product performs and make gradual adjustments based on measurable results.
For operators managing multiple machines, the same methodology can be standardized while allowing individual locations and product categories to use different final prices.
That creates a more scalable vending machine pricing system than relying on intuition, copied competitor prices, or a single markup rule.
Editorial Methodology
This guide is written from an editorial and commercial-analysis perspective. Recommendations are based on general cost-accounting principles, vending-machine operating considerations, product economics, location factors, and pricing methodology.
References to calculations, prices, costs, margins, or product scenarios are provided to explain the methodology unless otherwise stated. They should not be interpreted as claims that every vending business, location, product, or machine will produce the same result.
We intentionally avoid presenting hypothetical examples as personal operating experience or guaranteed business outcomes.
15. Editorial, Financial and Compliance Disclaimer
Important: This article is provided for general educational, informational, and commercial-reference purposes only. It does not constitute legal, tax, accounting, investment, financial, payment-compliance, or other professional advice.
All prices, costs, margins, formulas, commissions, and calculations used in examples are illustrative unless explicitly identified otherwise. Actual vending machine revenue, expenses, margins, sales volume, return on investment, and profitability can vary significantly depending on location, equipment cost, financing, supplier pricing, customer demand, payment fees, taxes, commissions, maintenance, labor, logistics, product selection, local competition, and other operating conditions.
No revenue, profit, sales-volume, margin, or return-on-investment result is guaranteed.
Laws and regulations concerning sales tax, VAT, GST, payment surcharges, card processing, consumer price disclosure, dynamic pricing, product labeling, food safety, age-restricted products, licensing, accessibility, privacy, electronic payments, and vending-machine operation vary by jurisdiction and may change over time.
Before implementing a pricing, payment, tax, promotional, or dynamic-pricing strategy, operators should verify current requirements with the relevant government authority, payment provider, location partner, accountant, attorney, or other qualified professional where appropriate.
Product specifications and software functions can also vary by vending machine model, country, payment system, configuration, and customization. Businesses should confirm required functions with the equipment supplier before purchasing or deploying a machine.
This article may contain links to Zhongda Smart products, tools, OEM services, or other commercial resources. These links are provided to help readers evaluate relevant vending-machine solutions. Readers should independently assess whether any machine, configuration, payment system, or service is appropriate for their specific business requirements.